Portfolio
All ProjectsCASE STUDY: New Platform [The CDP Pipeline]
The CDP Pipeline was an opportunity to create an internal digital Capital Deployment tool and give the company a good start on digital transformation.

This is an in-depth case study; for a summary, please see CDP Pipeline synopsis in the Annex section
FUNCTIONAL GOAL AND EXPERIENCE PRINCIPLES:
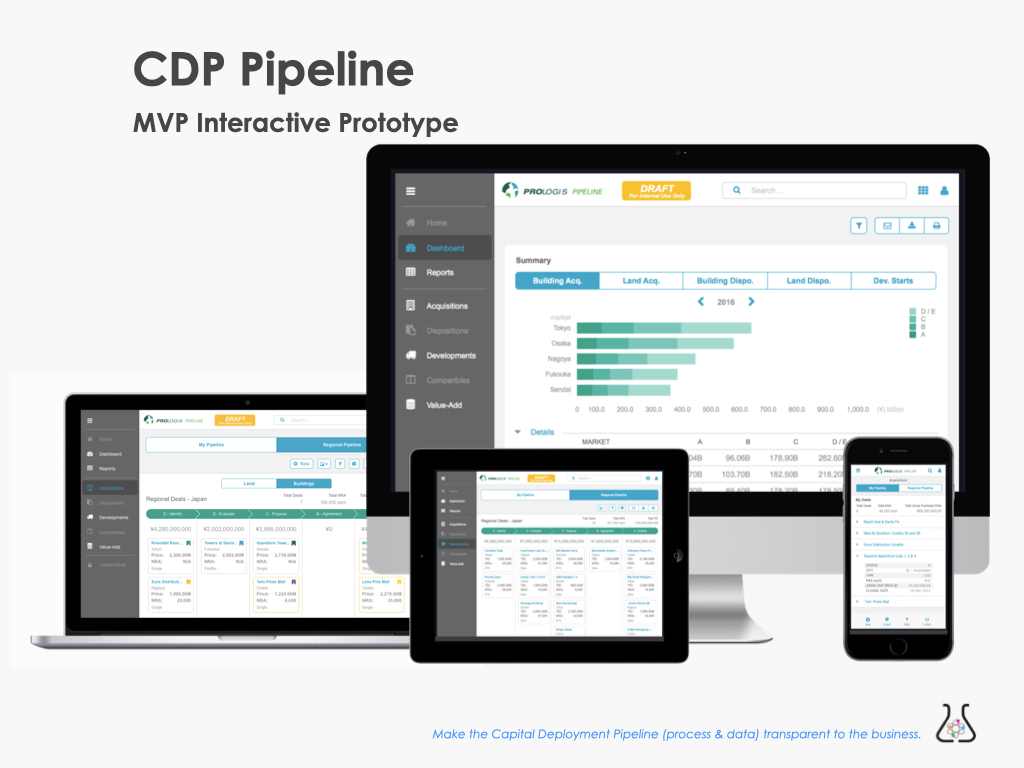
Make the Capital Deployment Pipeline (process & data) transparent to the business
PROJECT OVERVIEW
Agile/ Lean UX
UX/ Product Design: Myself + 1 jr UXer
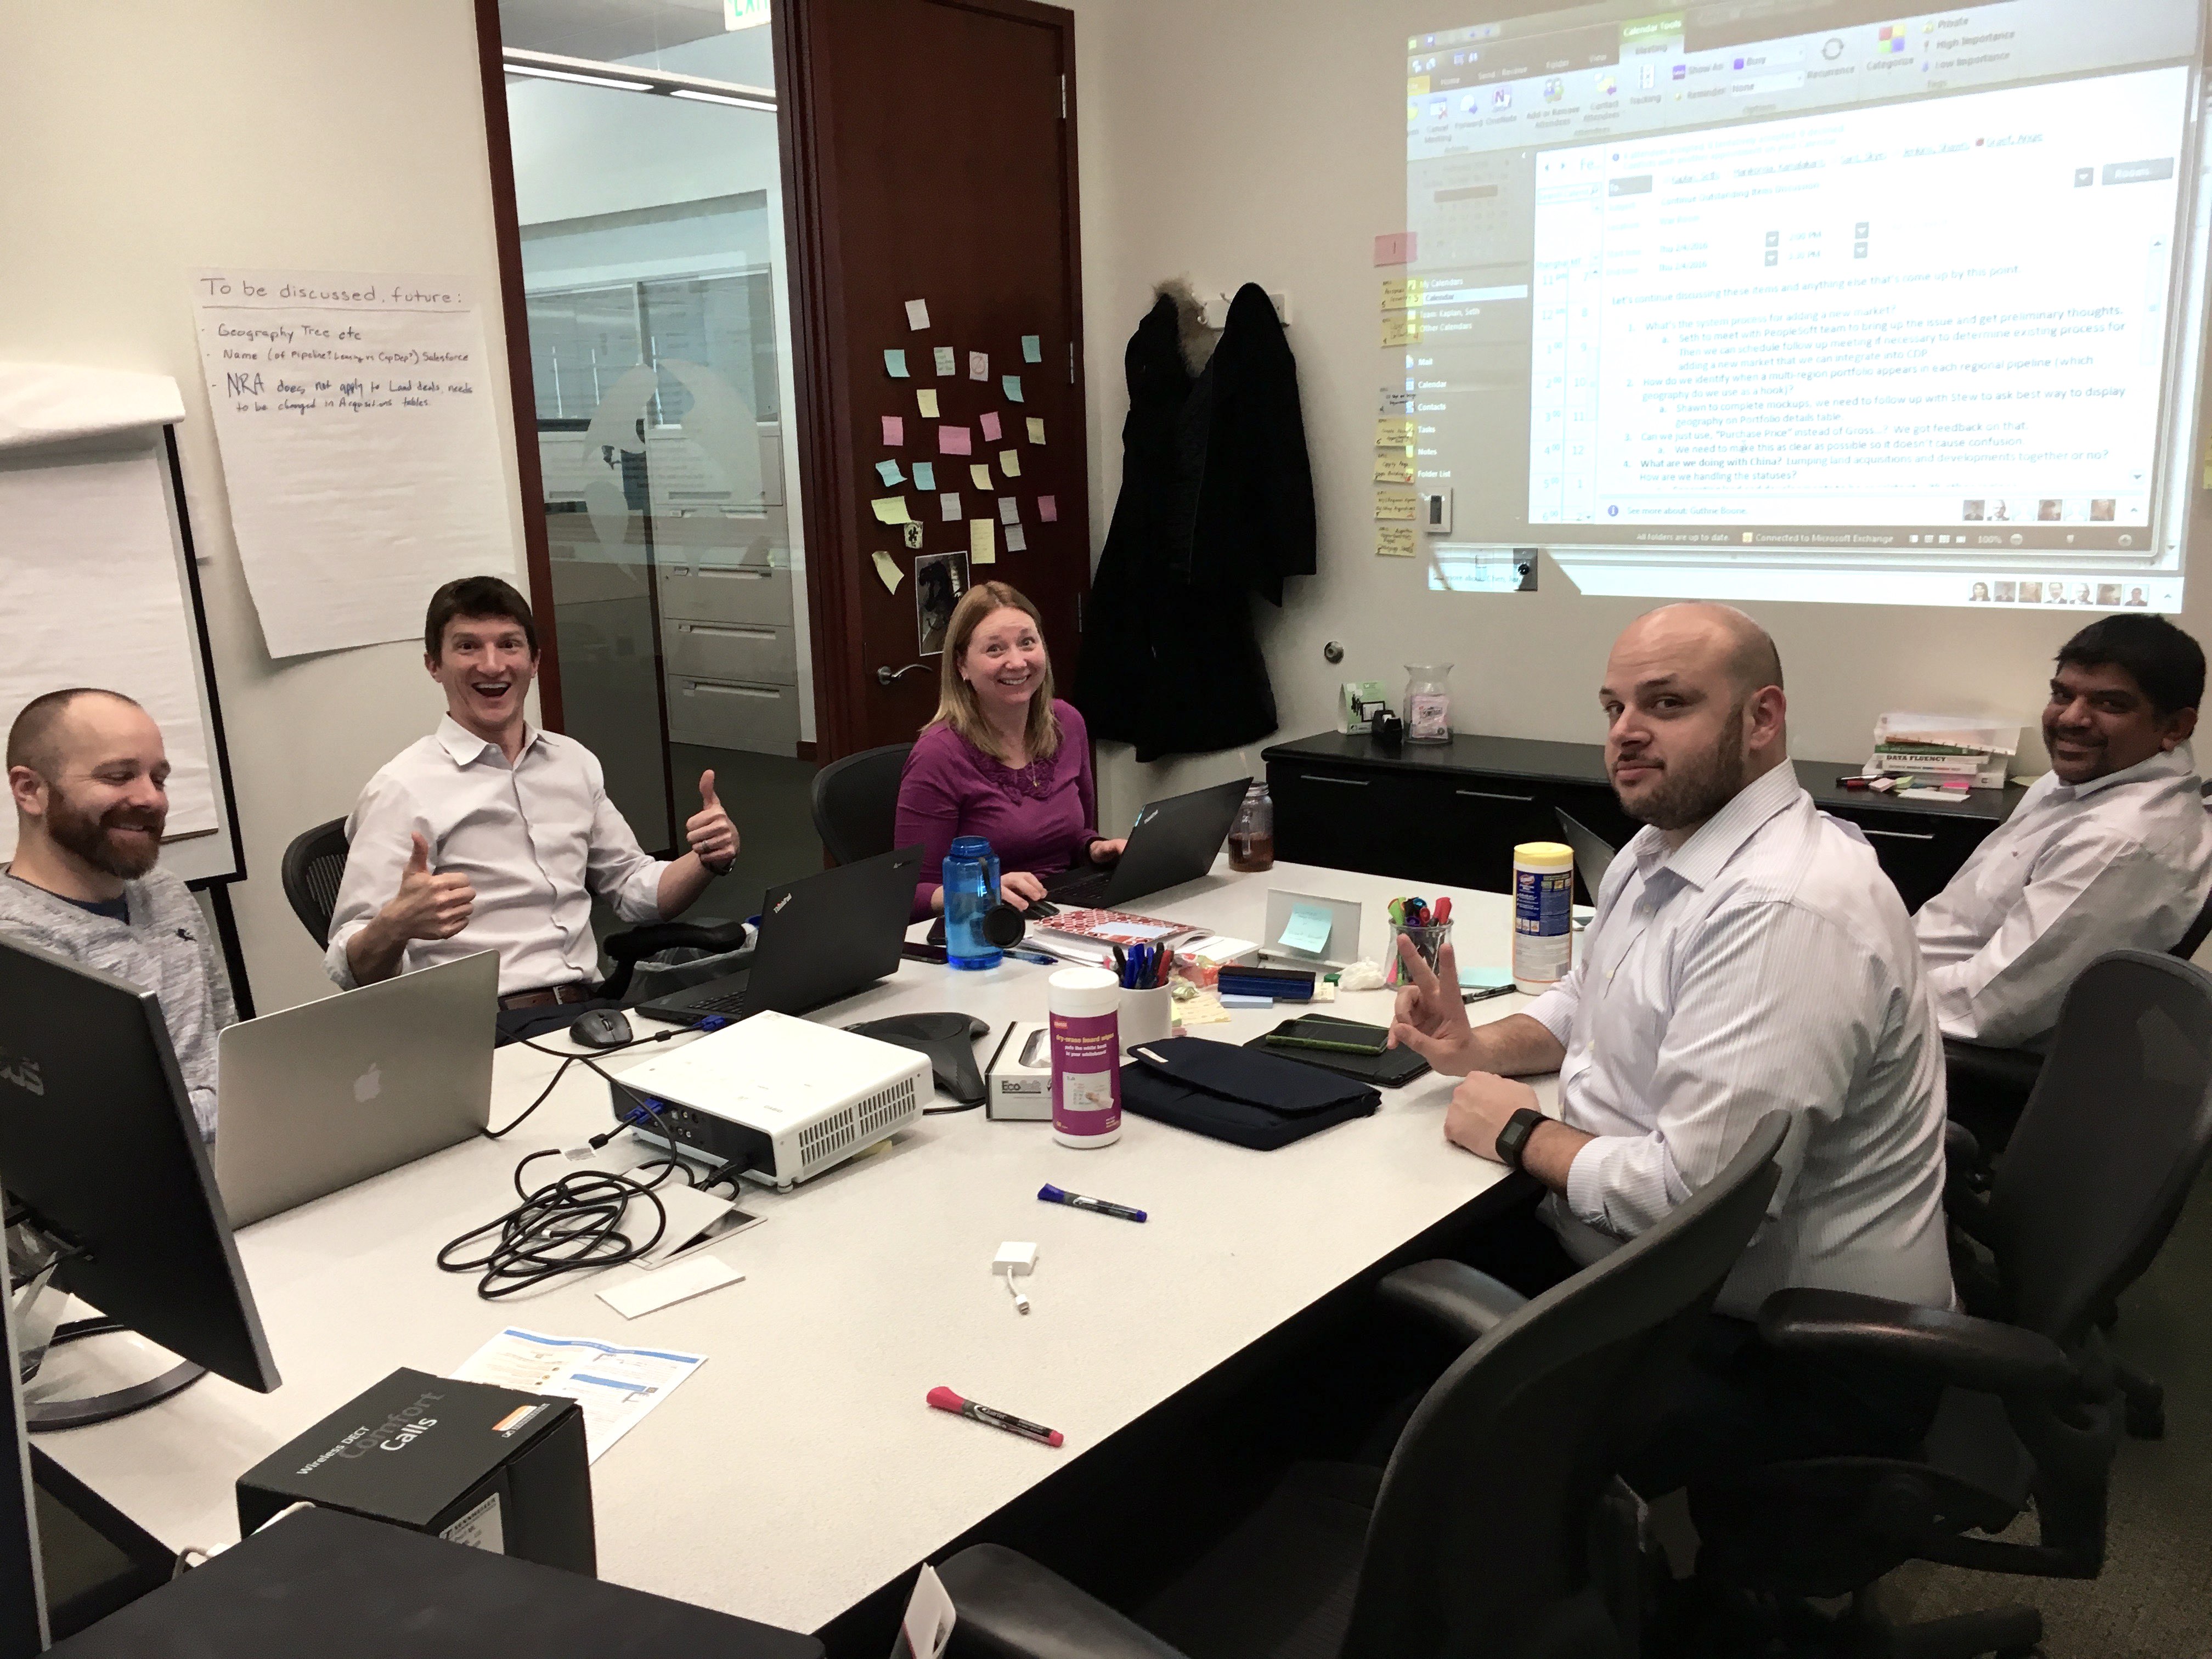
Team: Business + Product + UX + internal tech lead + dev teams (Lviv, Ukraine)
COMPANY
large multi-national, low digital maturity (desired digital transformation)
Legacy form: personal spreadsheet + emailed consolidated spreadsheet
PROJECT
Internal platform
Timeline: 6 months, on time and on budget (2015)
Desktop, tablet, and mobile
TEAM:
- 2 Product Managers: (business requirements)
- 1 Product Owners/ Business Analyst (user flows, user stories)
- 1 Project Manager: (planning)
- UX: me + 1 jr (UI corrections)
- Developers: 1 internal Tech Lead + 3 teams of 5 devs each (Lviv, Ukraine)
PROCESS
- Discover (SME interviews, content audit, design exercises, user validation)
- Design (visual + interaction design: user validation, agile development sprints, stakeholder alignment)
- Evaluate (interviews, user testing, top task analysis, surveys)
- Extend (possible product iterations & roadmap, supporting documentation, north star vision, lessons learned)
ABOUT
Capital Deployment is the decisions the company makes about where to spend money – buying, selling, improving, or developing land or buildings. The CDP Pipeline is a way to see what stage these decisions are in and therefore estimate money flow.
PROBLEM
Agents in the field were entering deals into personal spreadsheets and consolidating them for meetings – but the data was all different types and always stale, so the execs couldn’t make good decisions (based on old data, or numbers they couldn’t see).
GOAL
Make the Capital Deployment Pipeline (process & data) transparent to the business
For higher level outcomes and impact goals see the Discover tab
EVALUATIONS
- Ease of Use: 96% Success (add new deal <1 min)
- Increased Productivity: 73% Increase (less time on task, error rate, training)
- Satisfaction with the Tool: 4.52/5 Satisfaction
- Process Improvement: 4.93/5 Satisfaction
- (… more)
OUTCOME: Increased the capability to make the best proactive decisions and opened up the possibility of a complete ecosystem (pipeline to forecast). Additionally, internal employees saw the direct impact of their actions.
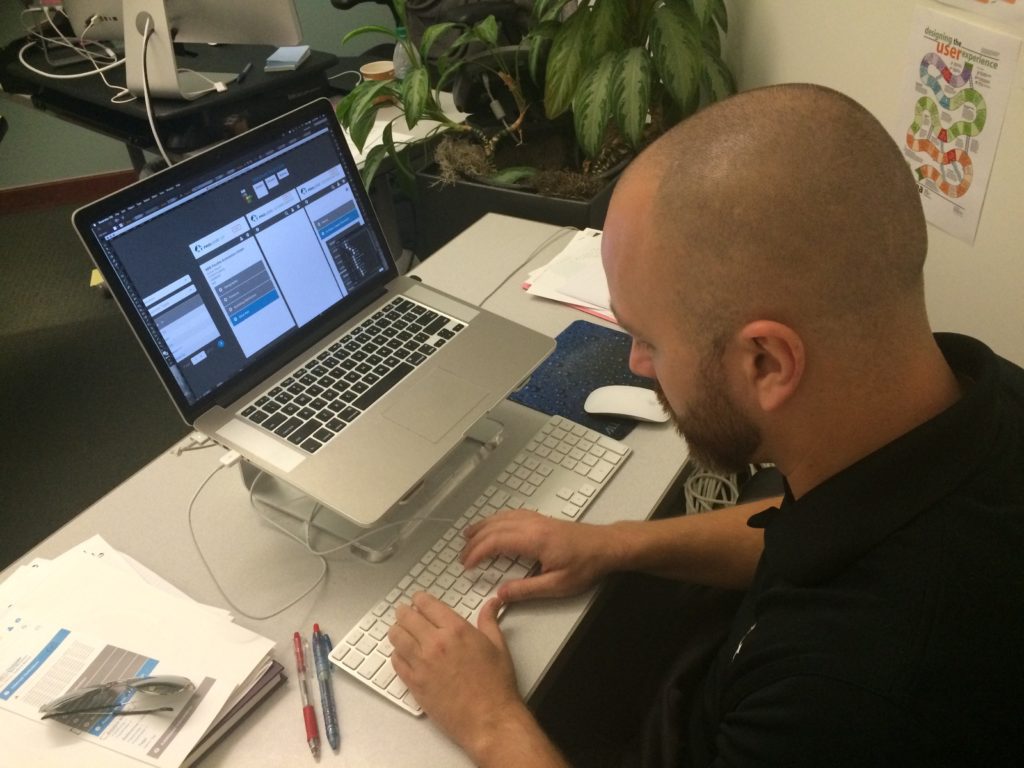
MY ROLE: Leading The Way
I was hired to guide the first agile project in this company, an SVP’s pet project.
- Helped staff a team
- Design and user validation (ethnography)
- Supported my PO and PM on strategy, buy-in through the org.
- Coached the team on helping with user tests and ethnography
- Collaborated with the devs every day (agile development overlapped validation)
-
JR UX; BA(product); Project Manager (product); Business System Owner; Tech Lead -
Dev Lead; Business Analyst (business); Lead Project Manager (company); Product Owner -

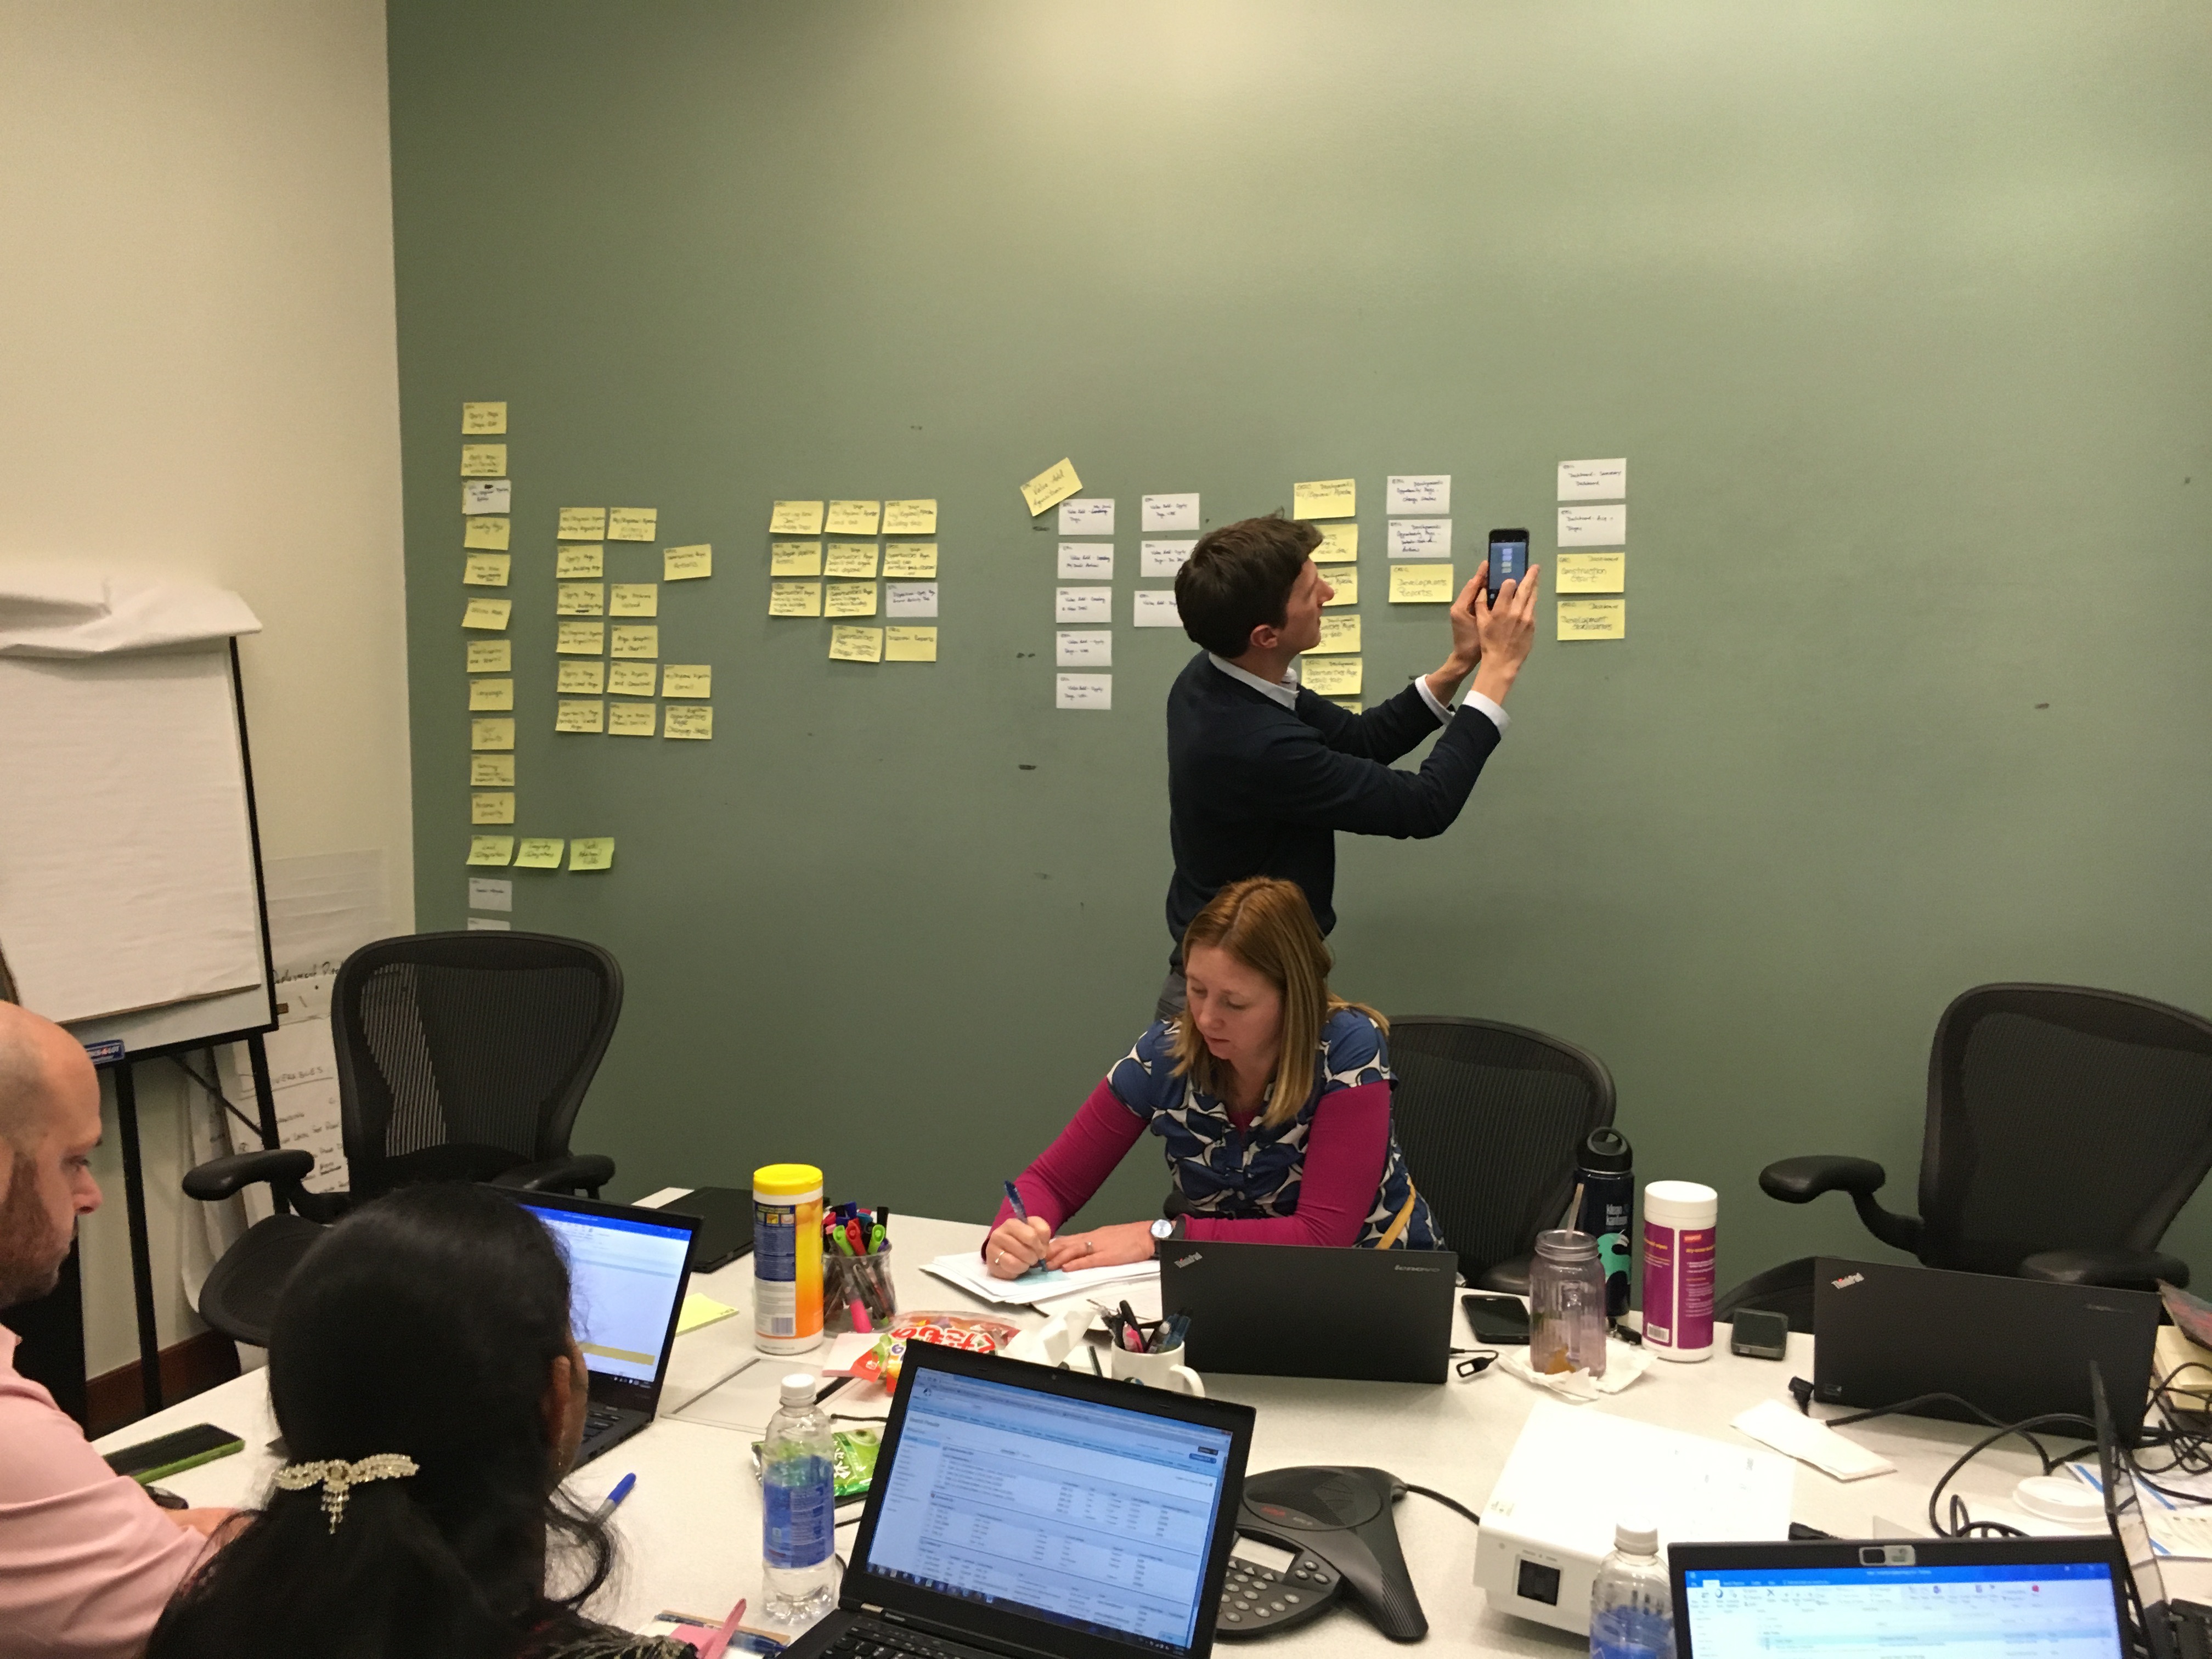
Global Ethnography: The 3 Amigos
DISCOVERY
At this stage, we concern ourselves with
• Assessment (what is)
• Research (what could be)
• Specs (what we need)
• Alignment: find allies and share the vision
The Problem
Capital Deployment is the decisions the company makes about where to spend money – buying, selling, improving, or developing land or buildings. The CDP Pipeline is a way to see what stage these decisions are in and therefore estimate money flow.
Each real estate agent was responsible for finding ‘deals’ (land or buildings to buy or sell) and moving the deal along until completion (‘the pipeline’).
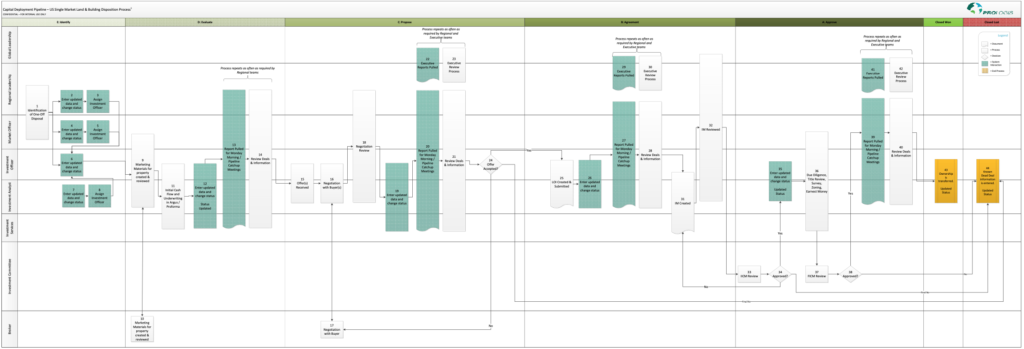
(Legacy) Flow and Known Issues:
| START >> | STAGE E >> | STAGE D -> A | DONE | |
| AGENT FLOW | Agent recognizes deal – notes details (‘napkin stage’) The info is inconsistent from person to person |
Deal entered into personal spreadsheet No transparency to the business |
Deal moves E –>A on personal spreadsheet Data isn’t visible to others – no one can help Deals can overlap |
Deal closed and entered into Salesforce |
| COMPANY FLOW | Exec does not know what’s happening | Informal touch-base with boss (verbal only) Exec cannot see real numbers – this convo is reactive only |
District meeting: – Spreadsheet is consolidated with other agents in the district – District spreadsheet shared via email Slow, incorrect, out of date info |
The company can see the deal and info Too late to mitigate any risk or take advantage of opportunities. |
“…have we seen one $@#% deal the info’s been right, yet? Why do we even spend 2 weeks rollin’ the numbers up if we can’t even use them at all ’cause they’re WRONG?!!”Executive, SouthWest US District meeting call
-
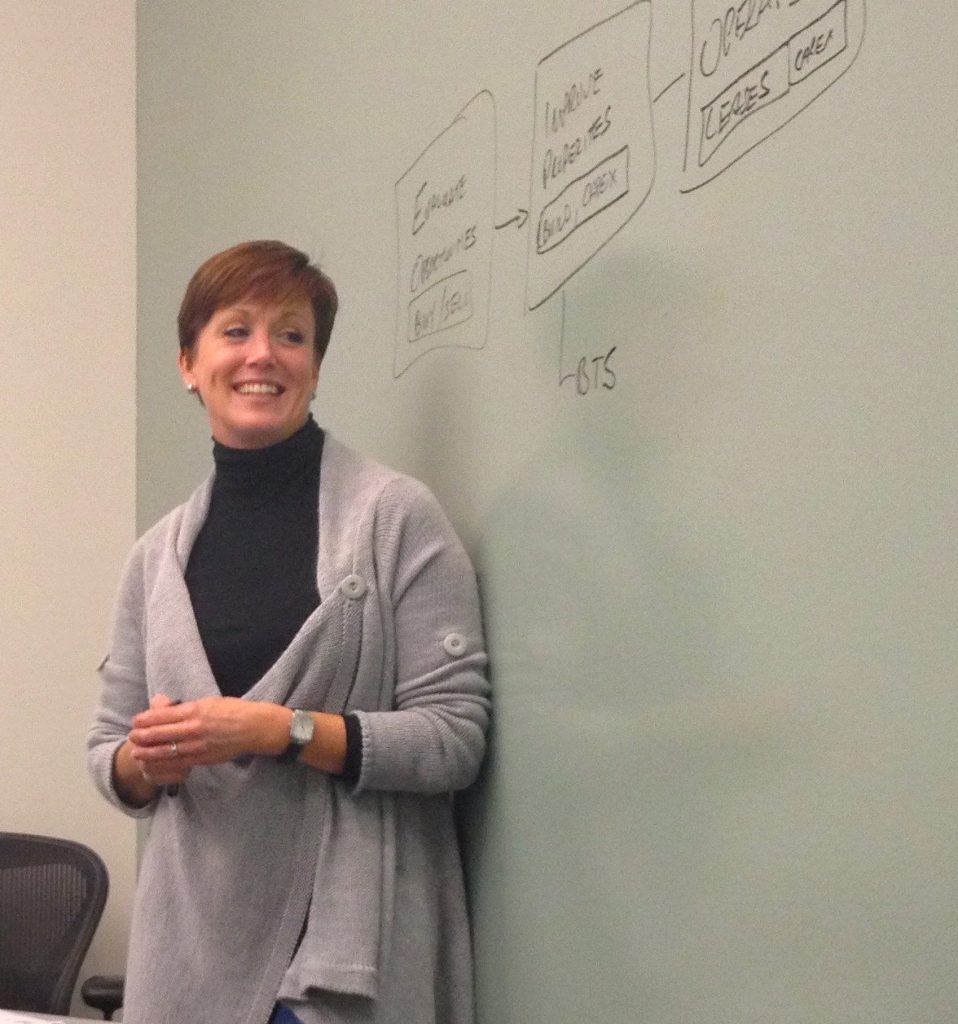
Rachael, Director of Operational Strategy -

Seth – Director, Global Operations and Capital Deployment -
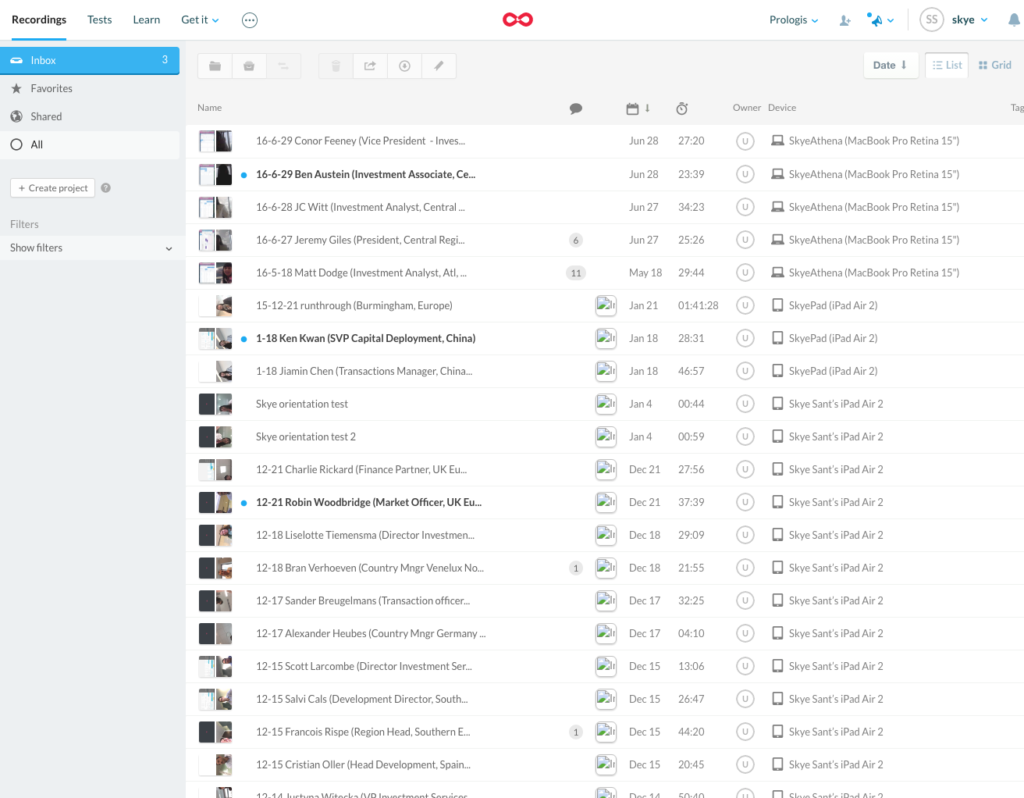
An example of the default pipeline spreadsheet
Discovery Process
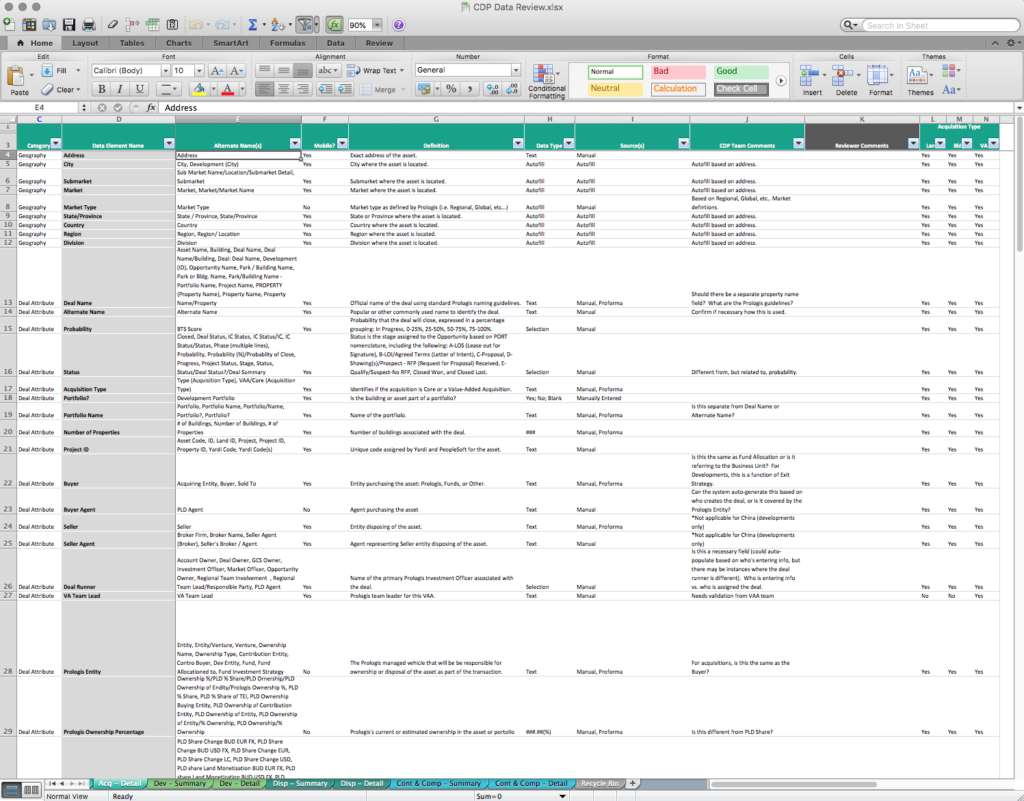
User-Centered Research Processes: Interviews: Users and SMEs Design Exercises Content Audits User Validation methods (Talk Aloud, Eye Tracking, A/B Testing, Top Task Analysis, Ethnography/ contextual enquiries)
Synthesising the research: Personas User Journey Map Mental Models Content Strategy Workflows Information Architecture Map Dependencies Experience & Design Principles Slide Decks (Vision/Strategy, Schedules & Project Management, Stakeholder Meetings) *Some assets not shown under NDA
-
Legacy workflow: paper -
KPI/success metrics, statements to validate -

Communication with the business -
Specs/ Requirements (data, architecture) -
Process flow (IA) -
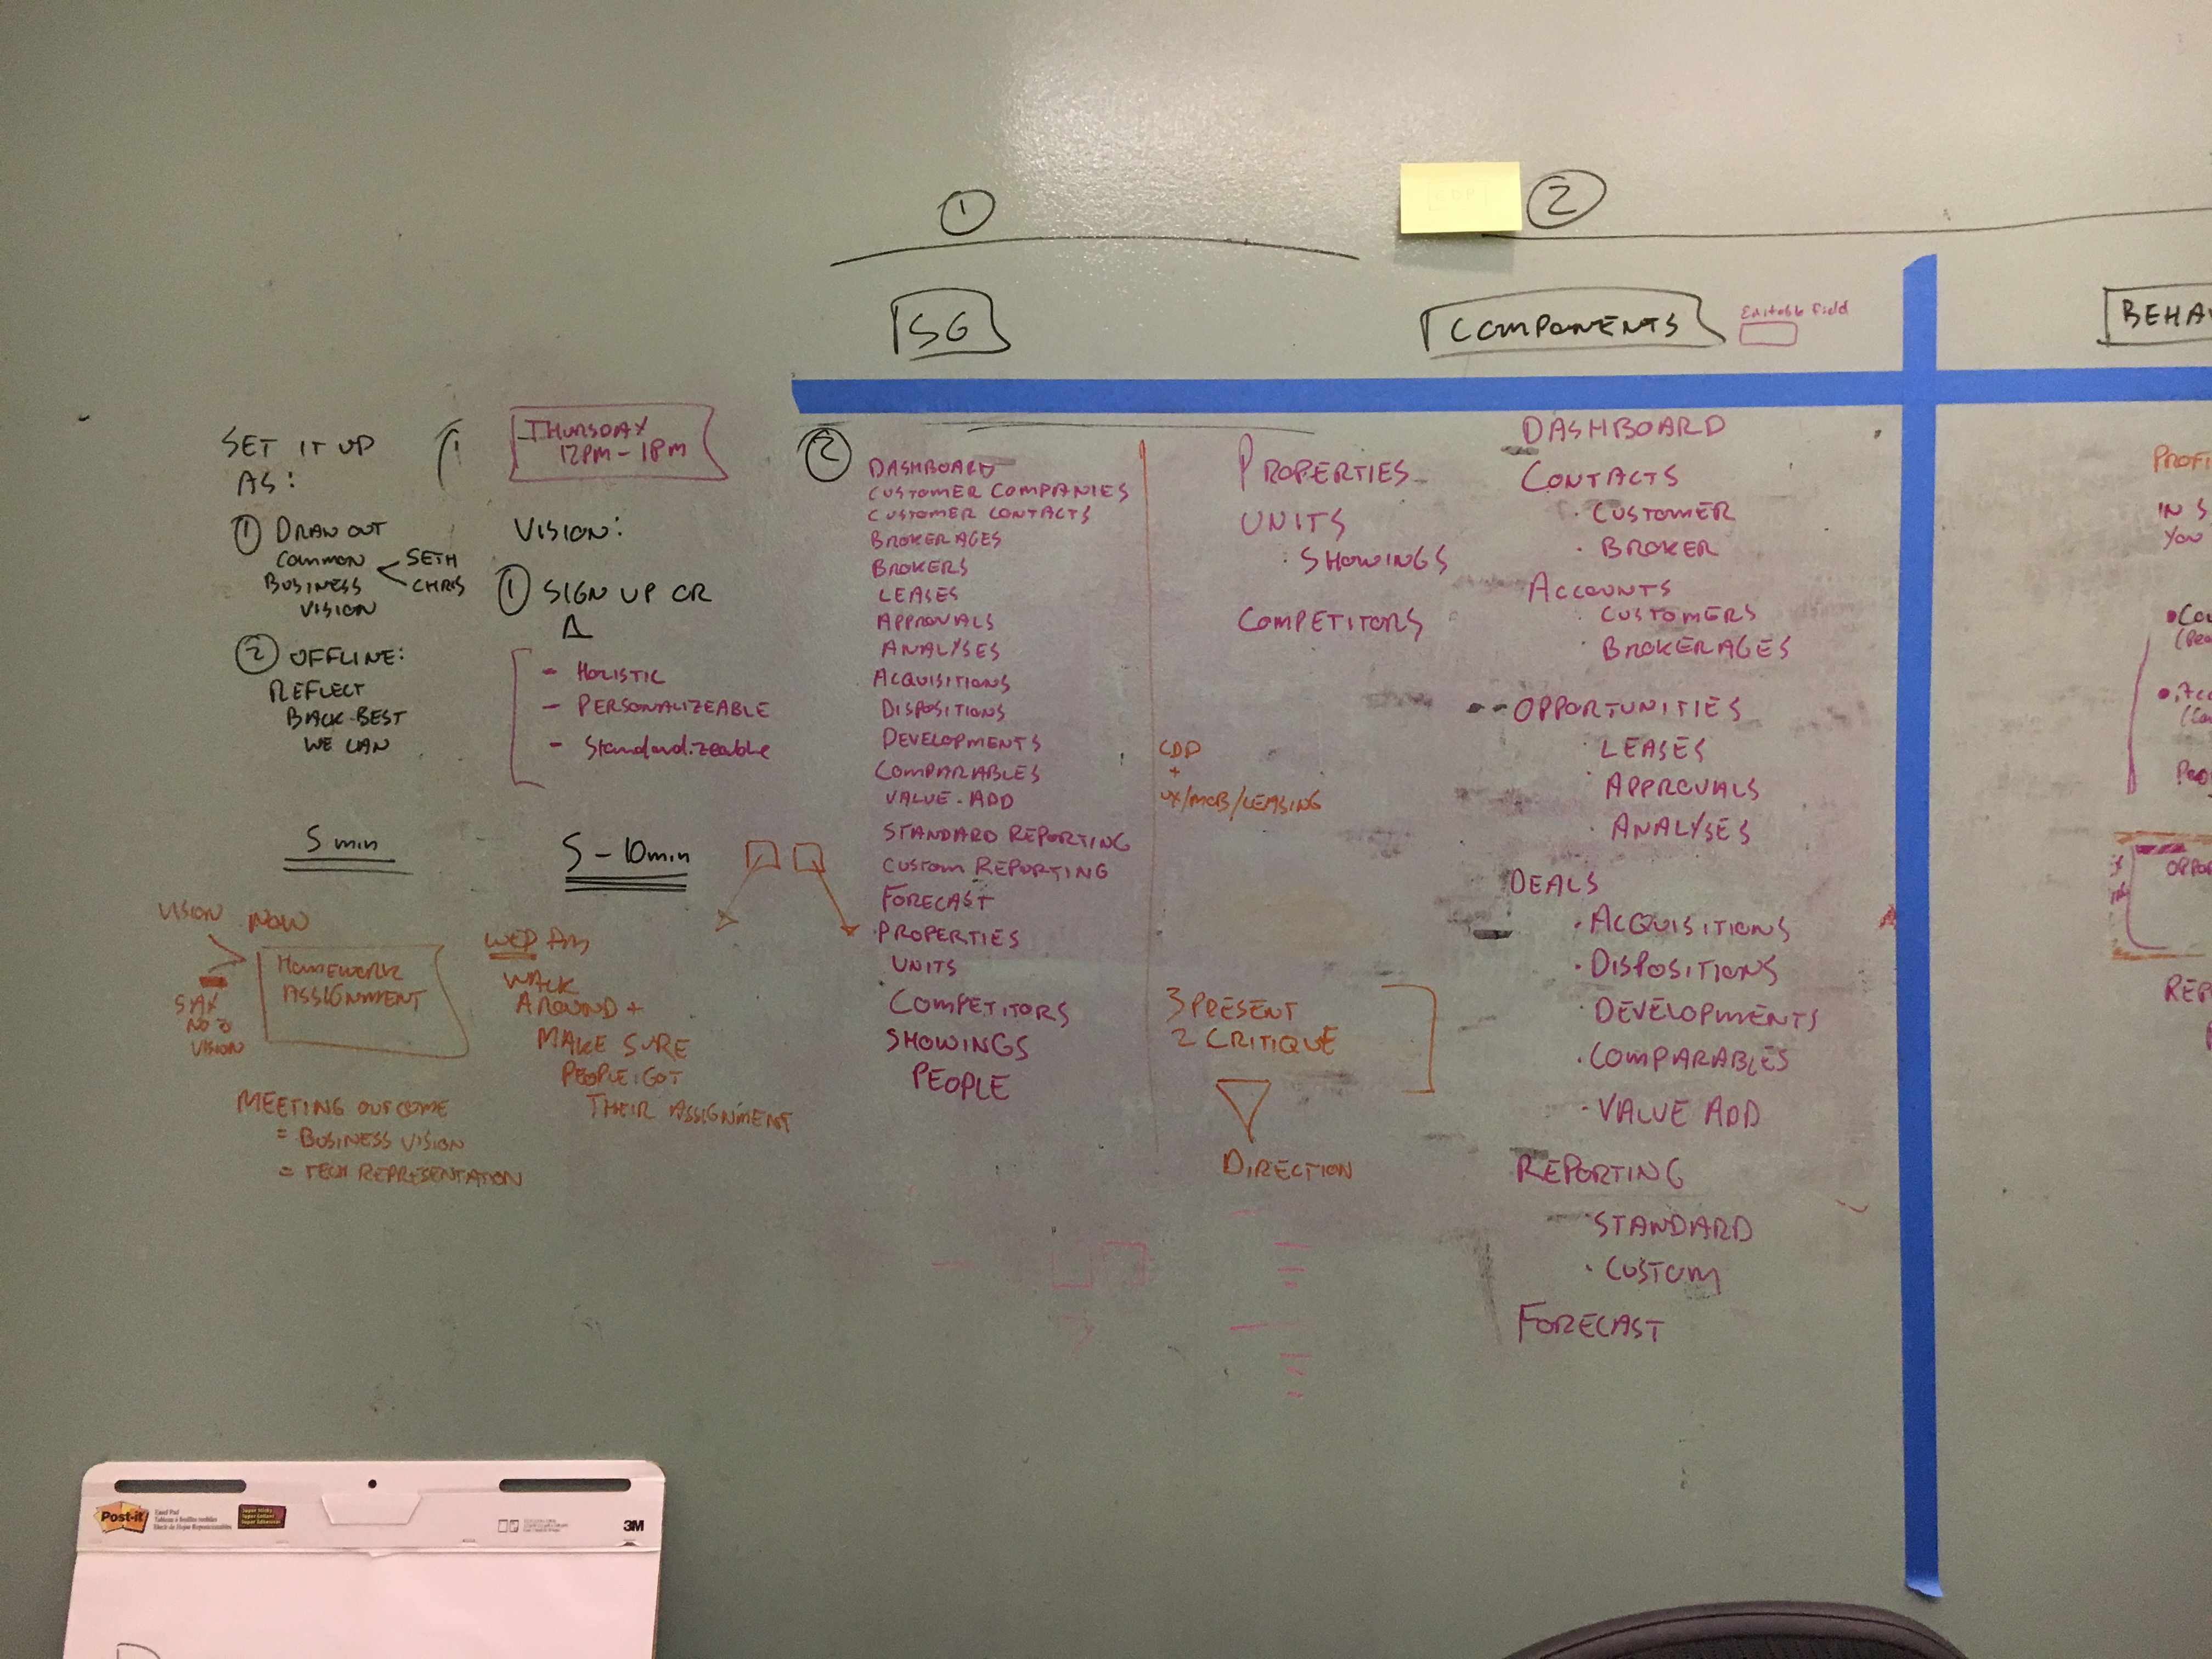
Whiteboard sketches


These methods illuminated profound unmet needs.
- Agent: The number of possible fields to enter data into was onerous – hundreds of fields on a spreadsheet – so people just made up their own fields which led to data mismatch and missing info.
- The data was often incorrect, or out of date, making meetings useless for proactive actions
- Executives: No transparency of info to executives, esp real time info, so they couldn’t proactively solve problems or make informed decisions.
- Employees: Neither tools nor processes were user-centered, leaving employees discouraged and disappointed with their tools (and company!)
Strategy
1. UX Outcomes
If we do our job well, how will our internal colleagues’ lives change?
- The agents will be empowered by seeing the full and immediate impact of their efforts and choices.
- The executives will be able to take informed, proactive action
Business Outcomes
If we do our job well, how will the business improve?
- Increased organizational effectiveness and strategic decision making
2. Experience and Design Principles
FUNCTIONAL GOAL: Make the Capital Deployment Pipeline (process & data) transparent to the business
3. Metrics (and thresholds for success):
- Ease of Use: add new deal <1 min (success is >75%)
- Increased productivity: lower time on task, decreased error rate, less training time (success is >25% increase)
- Satisfaction with the digital app (success is >3.5 out of 5)
- Process Improvement: satisfaction with user-centered design (success is >3 out of 5)
- TEAM: Satisfaction with the digital tool (success is >3/5)
- TEAM: Satisfaction with the agile, user-centered process (success is >3/5)
- TEAM: Budget and timeline (success is 100% on time/ on budget)
Two Personas: An Agent and an Executive
An Agent, who needed to quickly enter info while out in the field (car, walking)
An Executive, for whom we needed to enable strategic decision making to increase organizational effectiveness


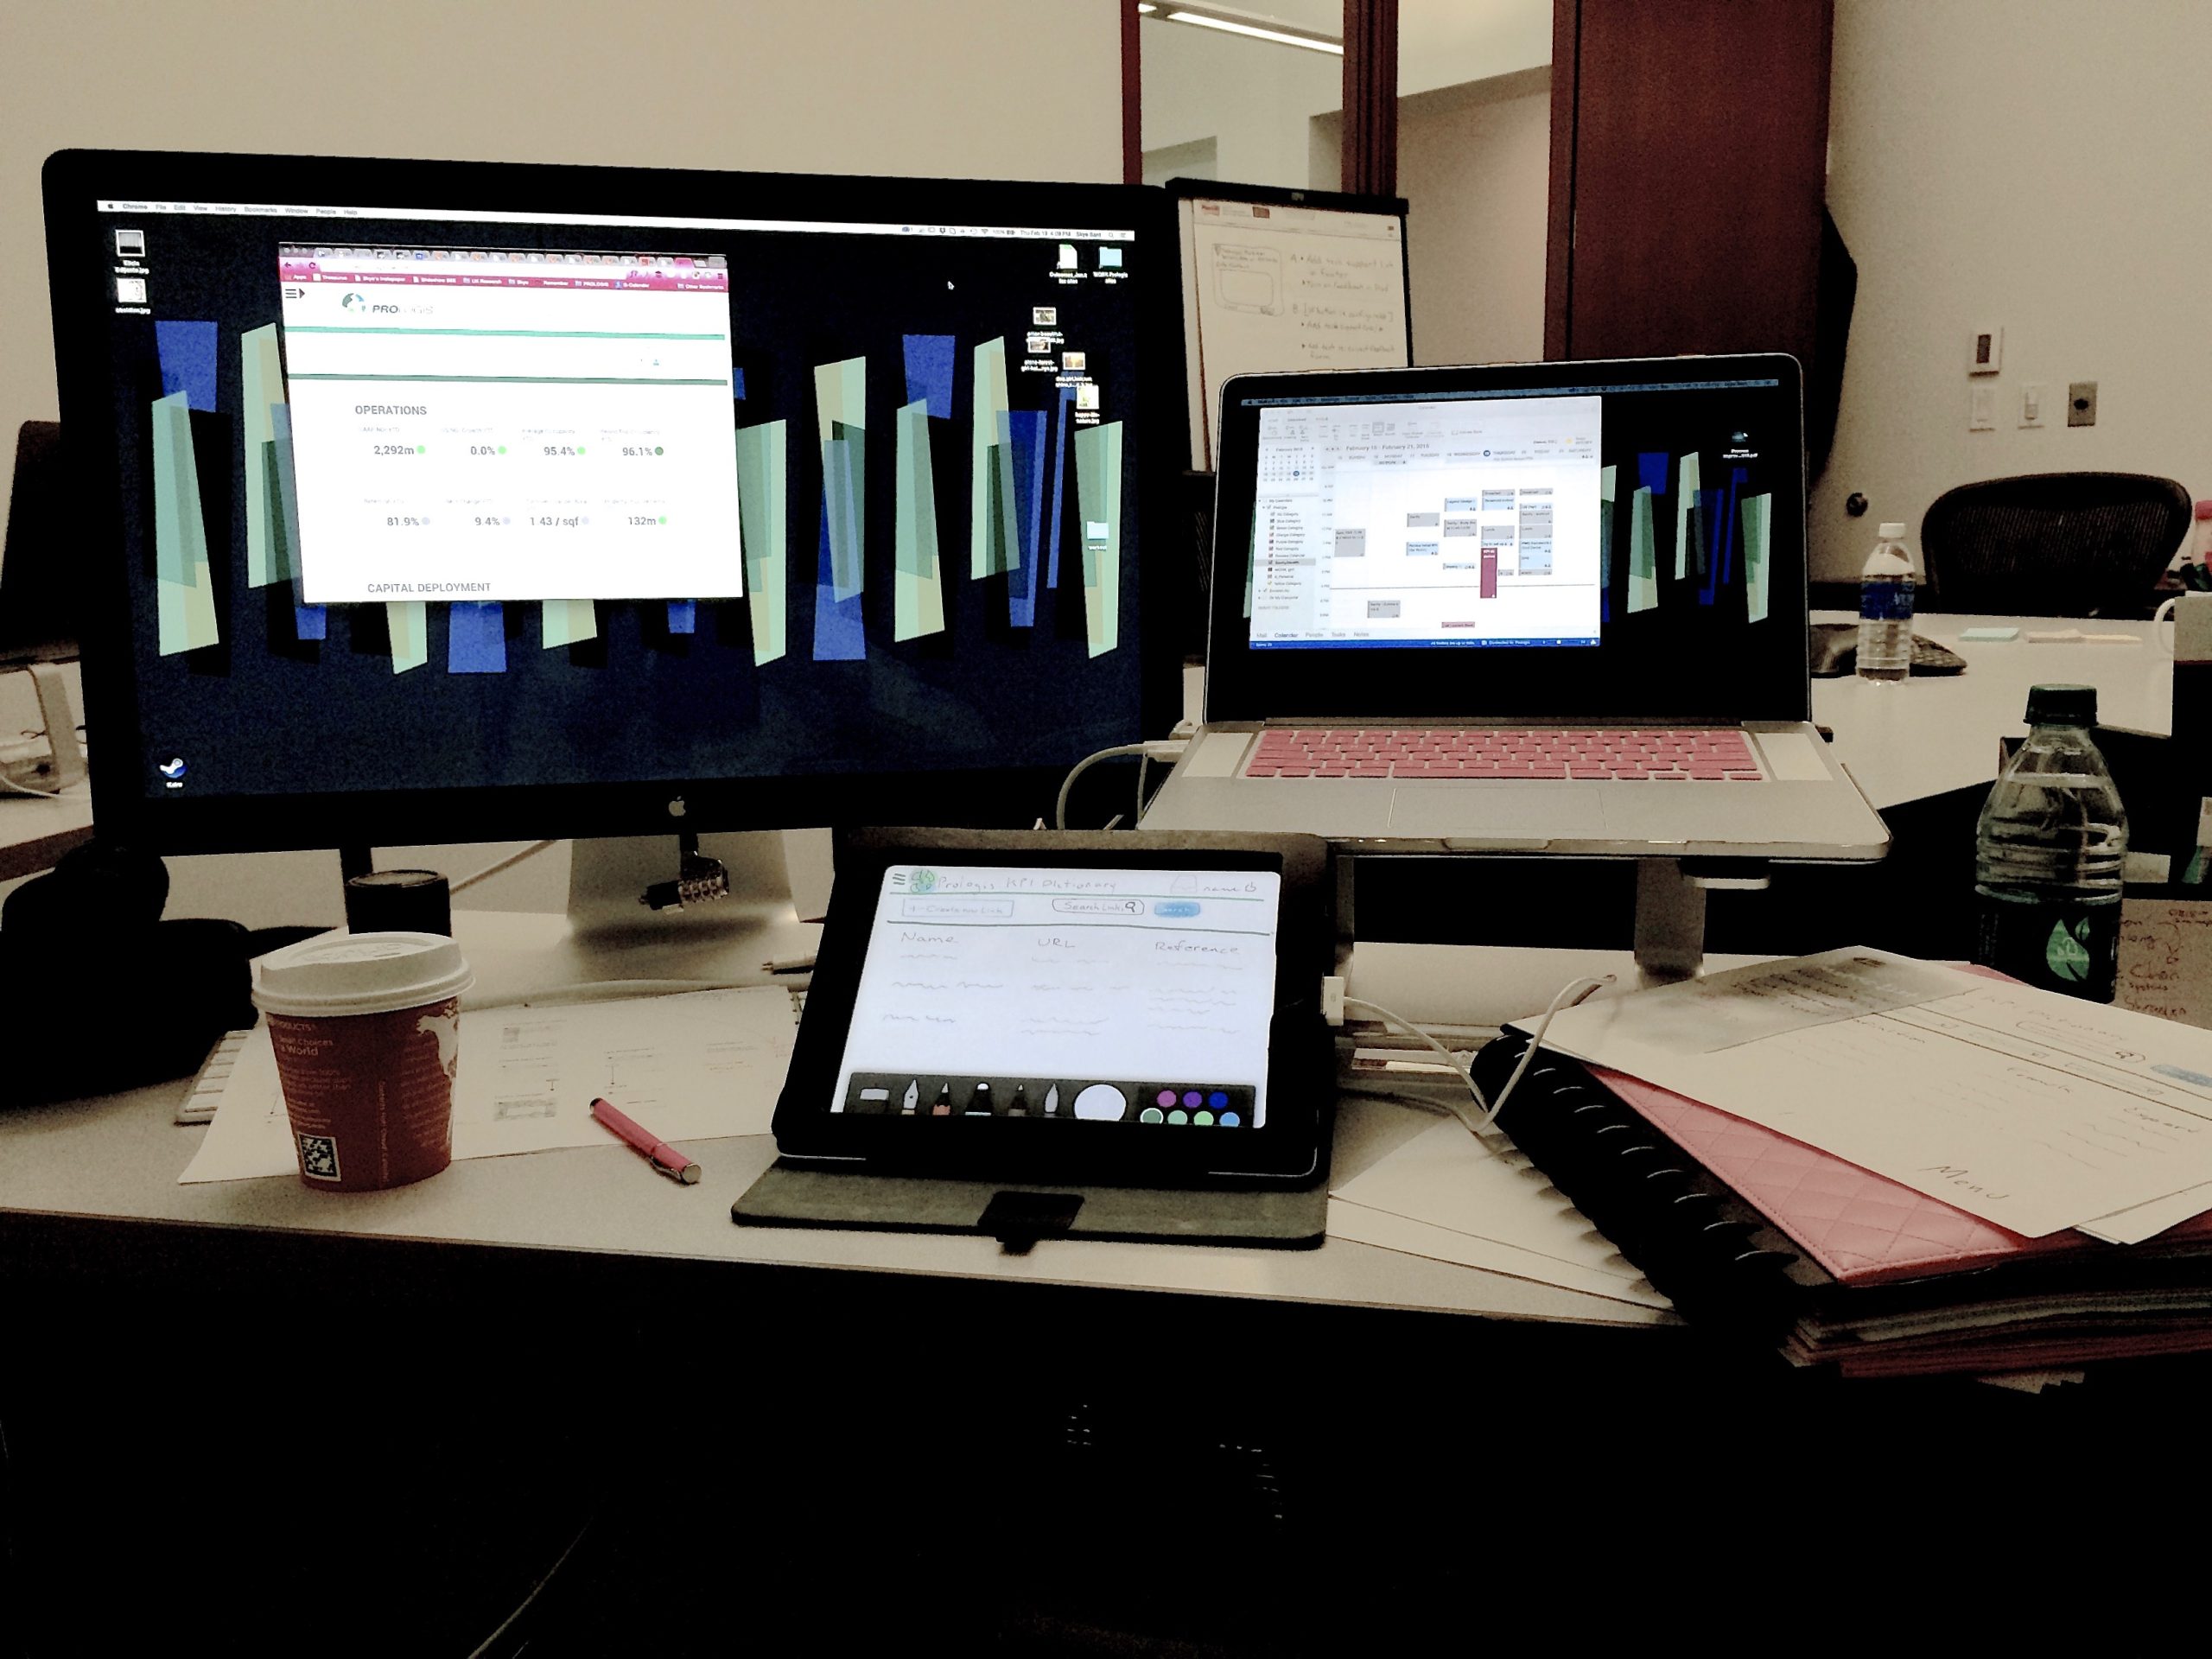
DESIGN
At this stage, we concern ourselves with
• UX design processes
• (Agile) development
• Communication
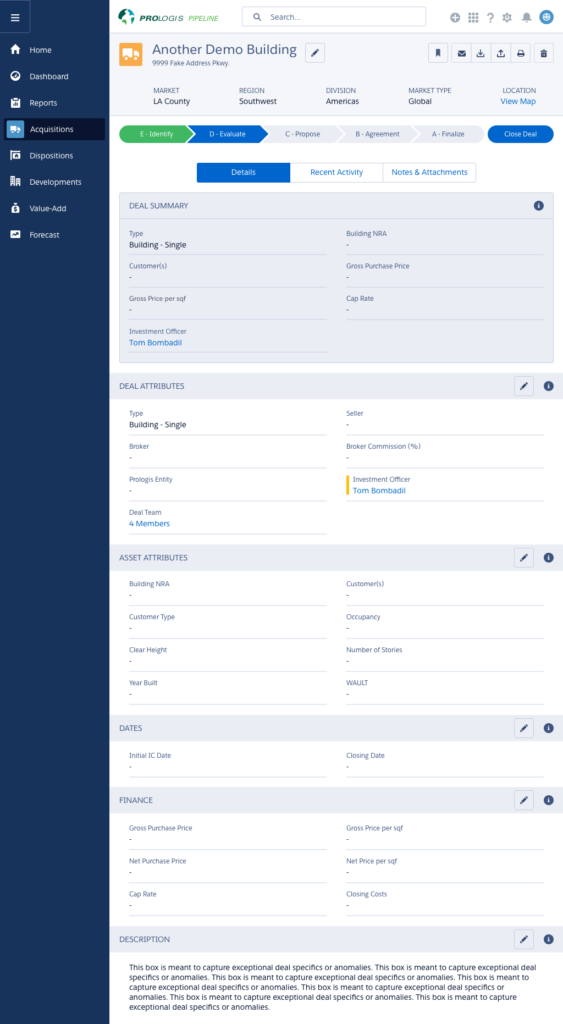
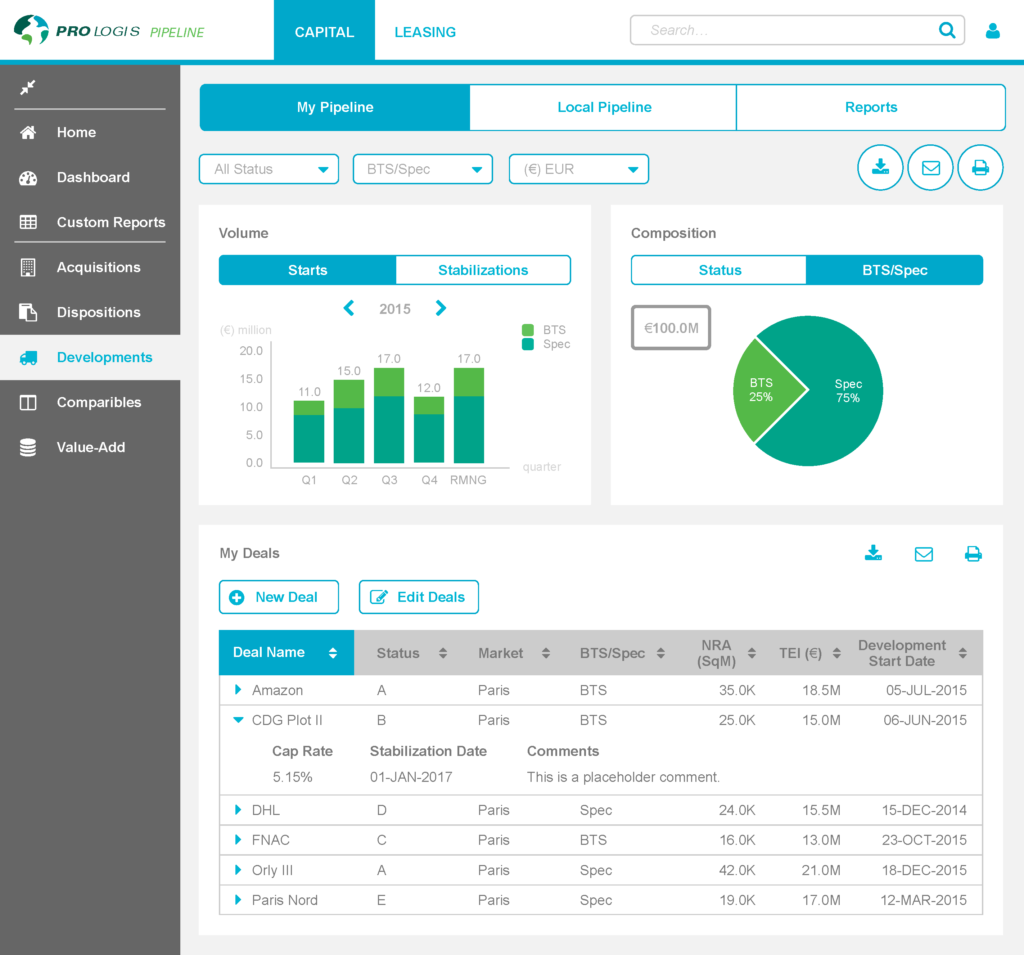
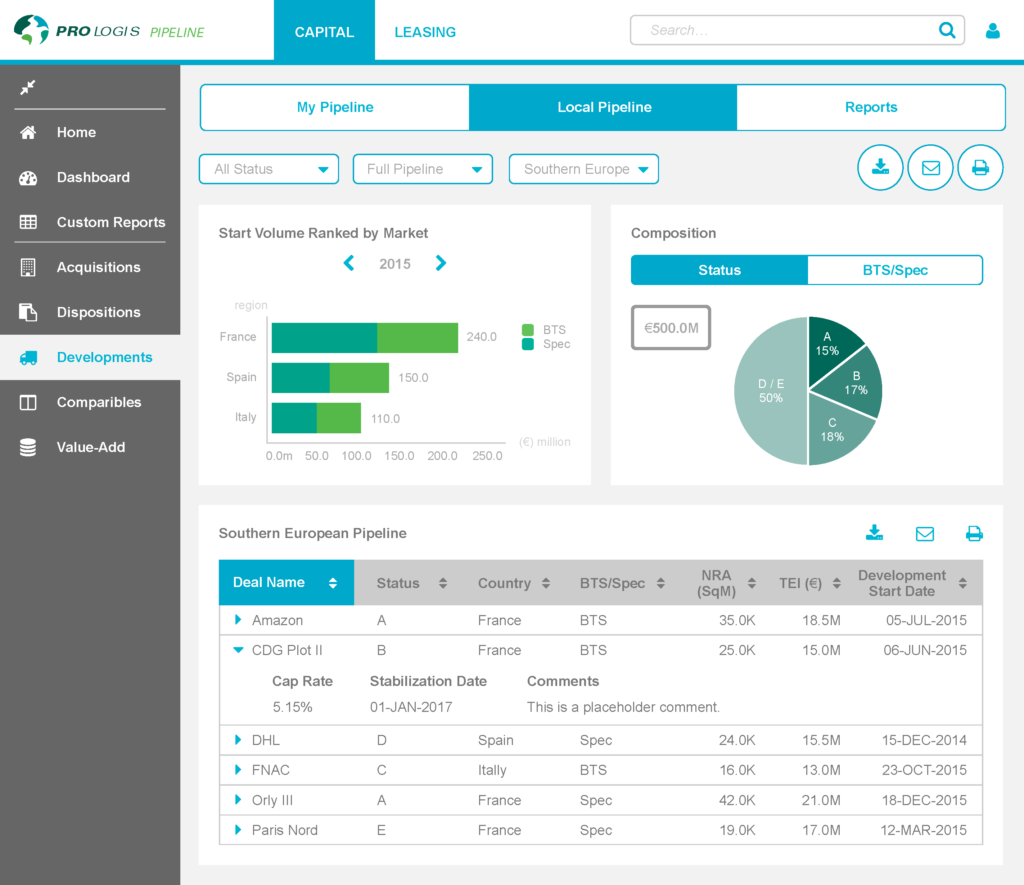
We designed initial mockups in the global office, running lunchtime and hallway tests to assure usability. Doing this we identified the components and pages needed.
- Overall functionality: Create a tool to gather the info from the agents in the field and surface it in an ‘always up to date’ digital platform
- Agents add deals in the field
- Agents manage their own deals
- Agents and execs see the up-to-date info in a digital platform
Notable user needs:
| Personas | User Need | Feature/page |
|---|---|---|
| Agent (add deal) | Simplify entering deals | – Easy “quick add” model (min necessary fields) – Mobile optimized (add) functionality – Offline mode |
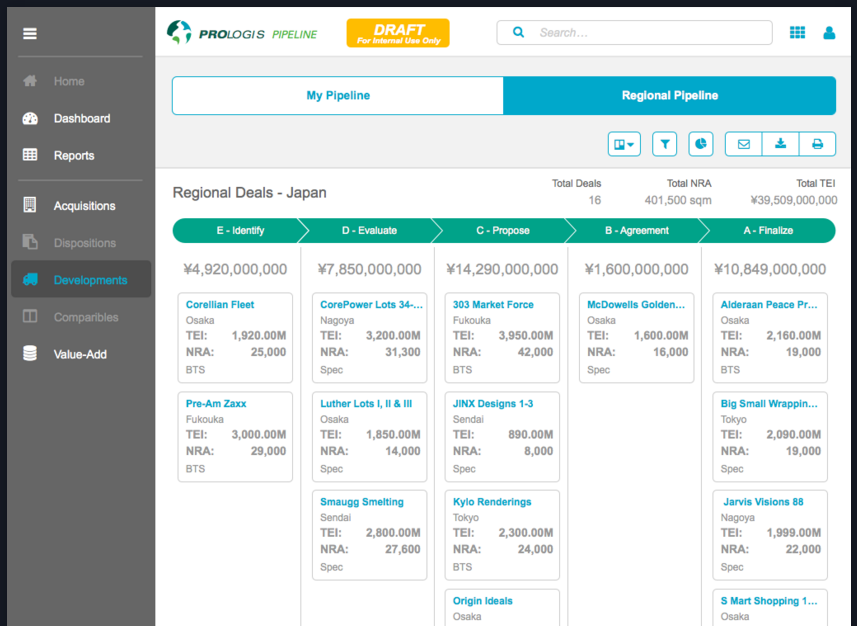
| Agent (move deal along) | Make it easy to update my deals | – Kanban view mirrors process – Prioritize quick functions: add [mobile optimized], update, move (drag and drop) – Smart default fields; few ‘required’ – Individual deals pages (smart default fields based on geography) – Refresh often (info never out of date) |
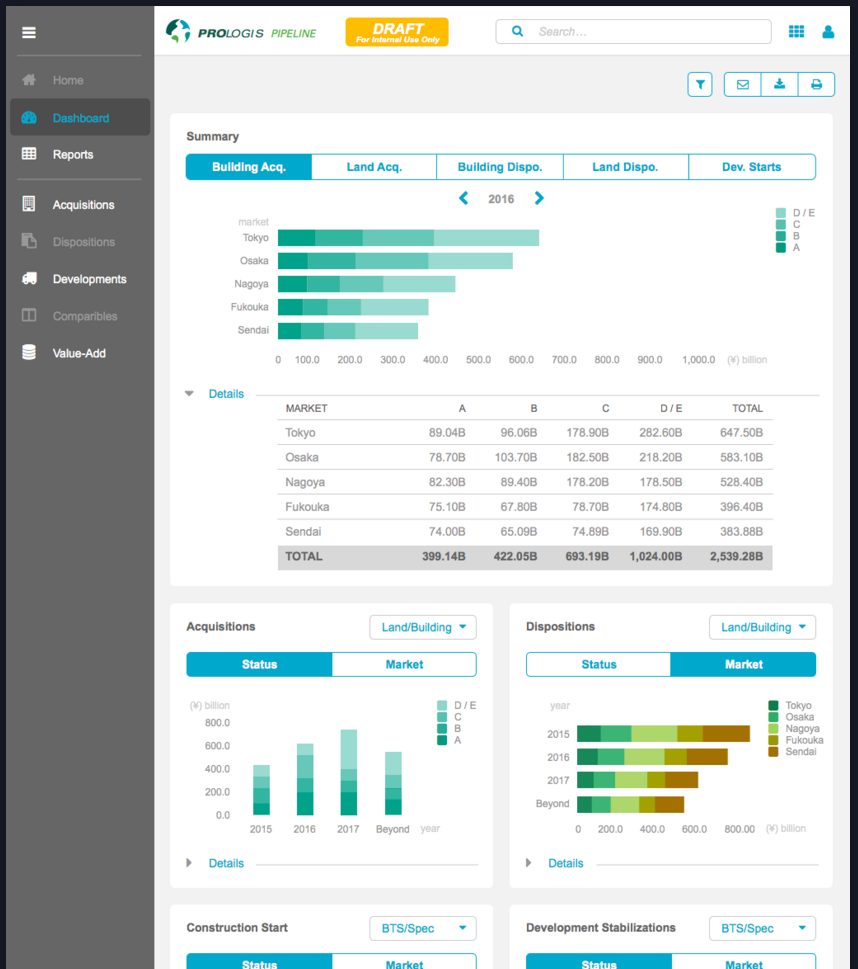
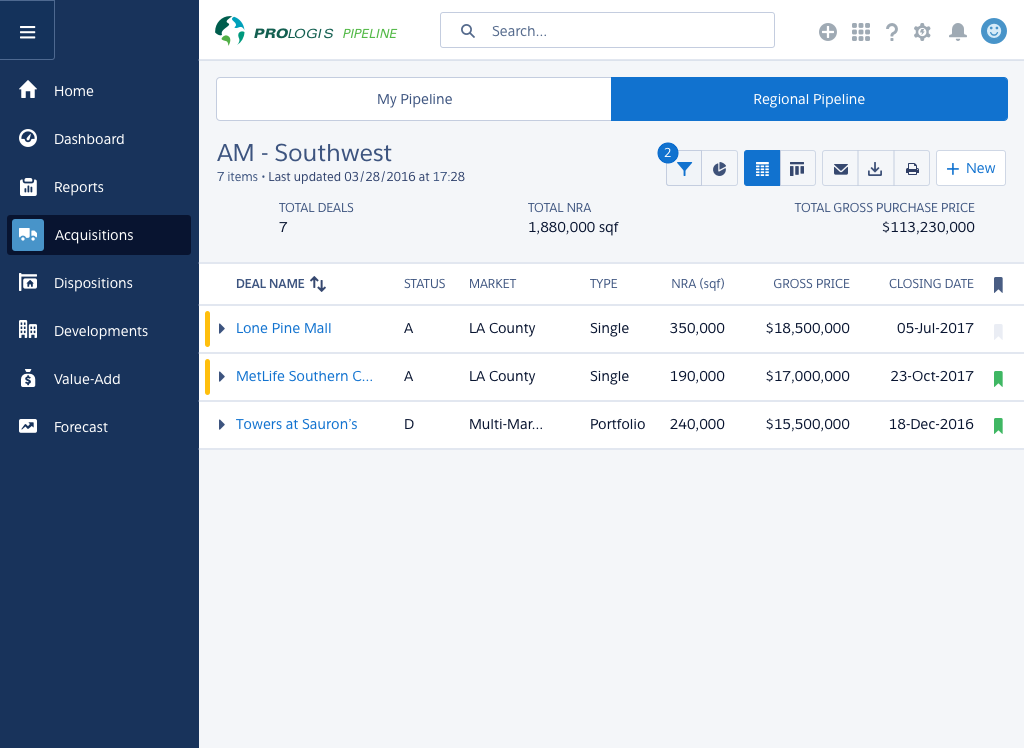
| Exec | Show me real time information | – Desktop optimized view – Main dashboard [desktop optimized](dept. meetings + visualization of data) – Aggregated main page (with several roll-up views) – Print and project functionality (for dept. meeting) – Customized for each Region + Country |
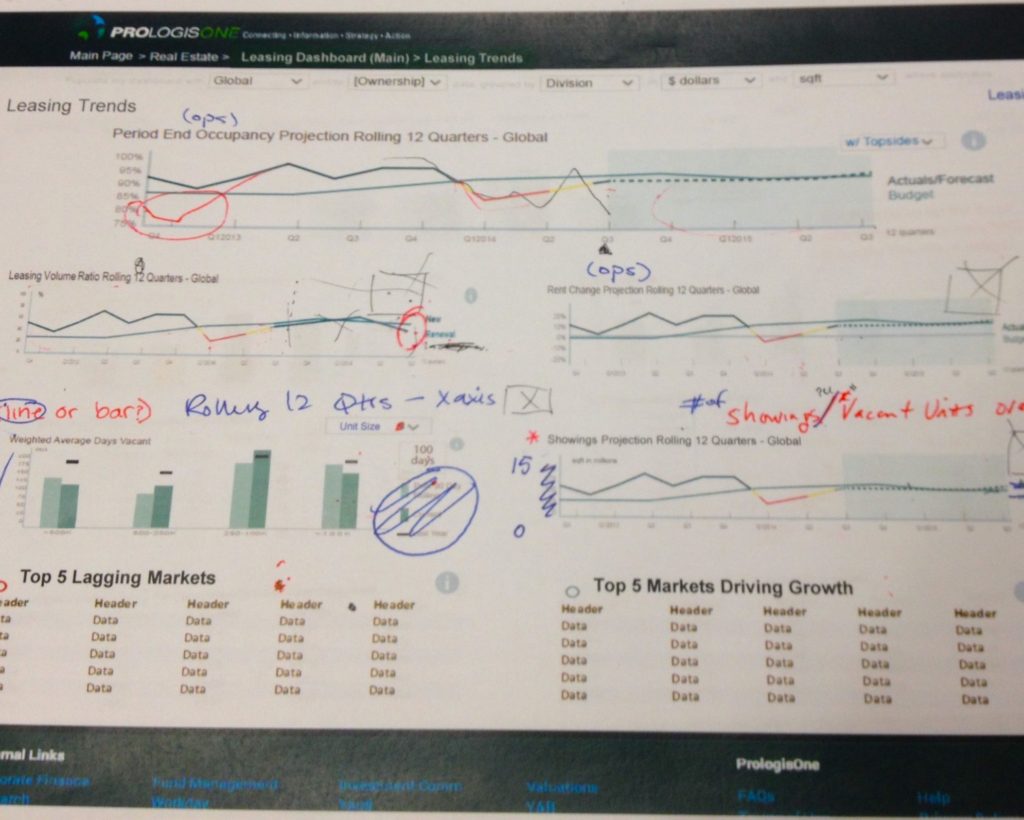
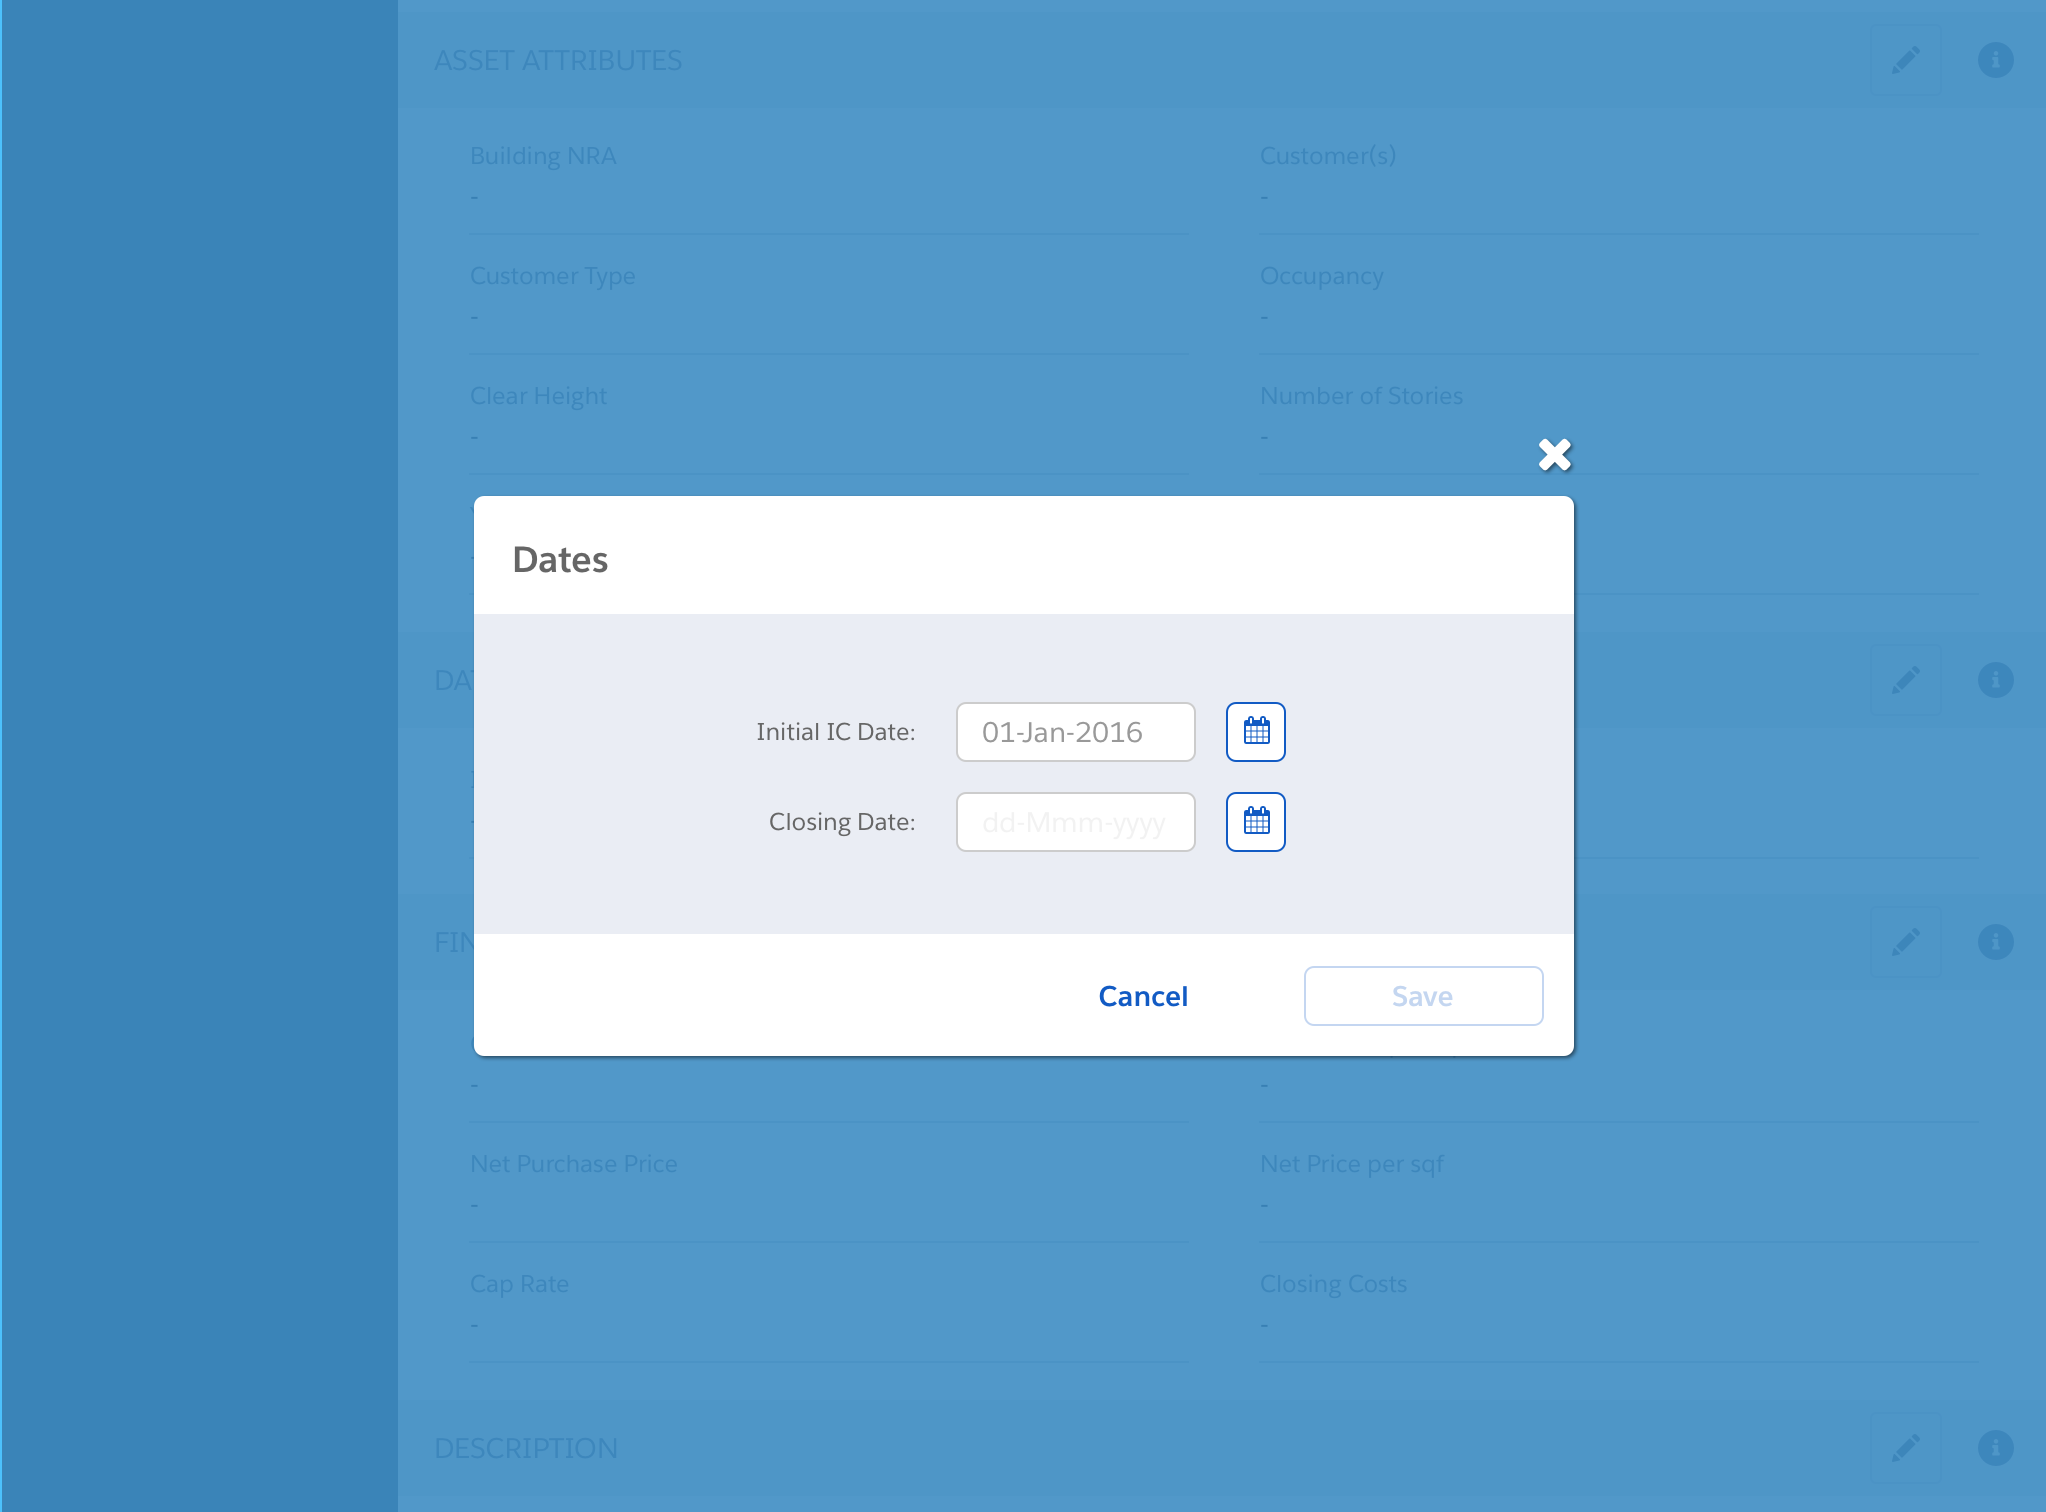
Visual and interaction design
-
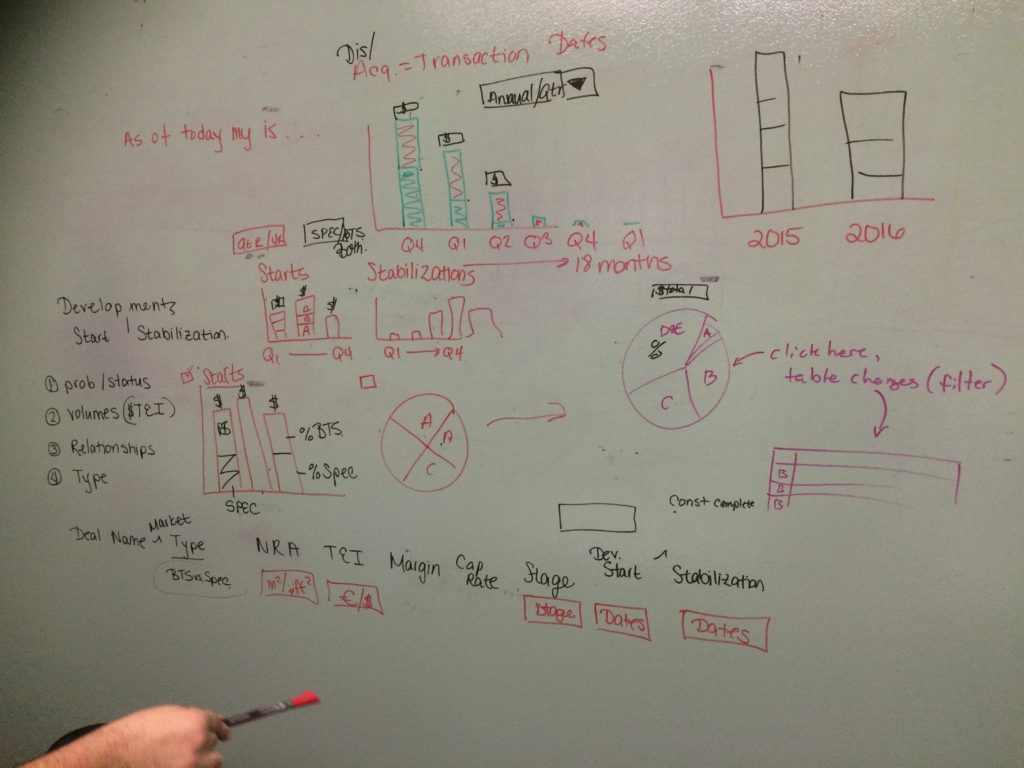
Pipeline dashboard whiteboard session -

Add a deal (modal) -
Pipeline dashboard sketch -
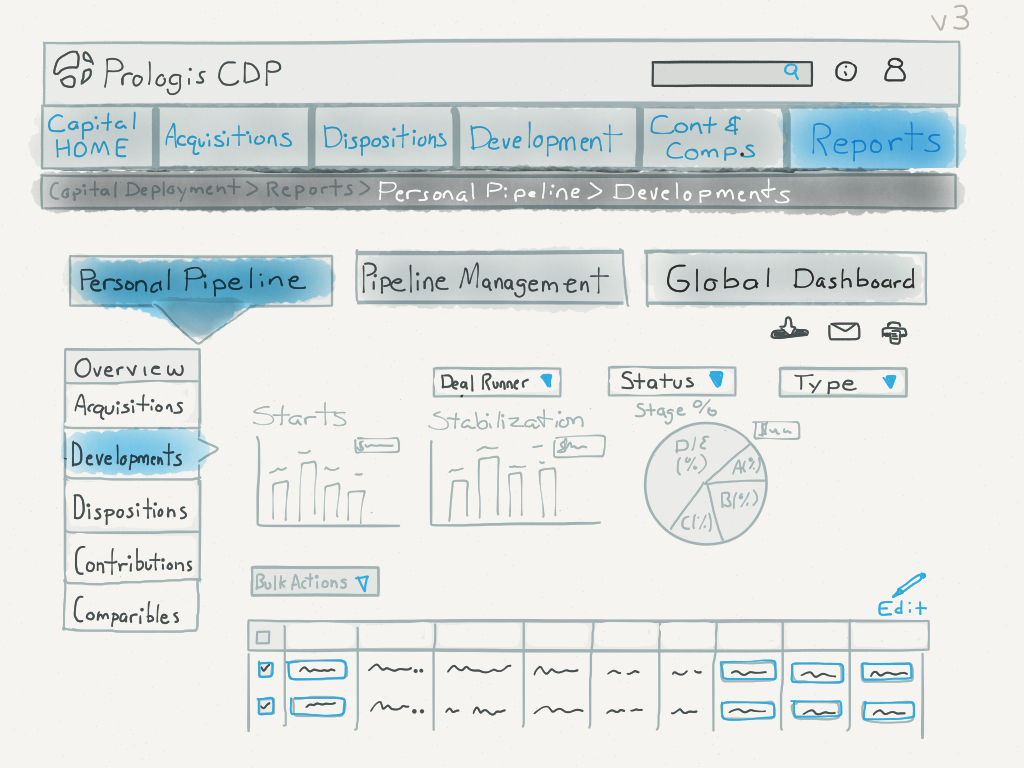
Pipeline dashboard mockups

Validation and iteration
Validation methods: Design Exercises – collaborative creation User Validation methods (Talk Aloud, Eye Tracking, Ethnography/ contextual enquiries)
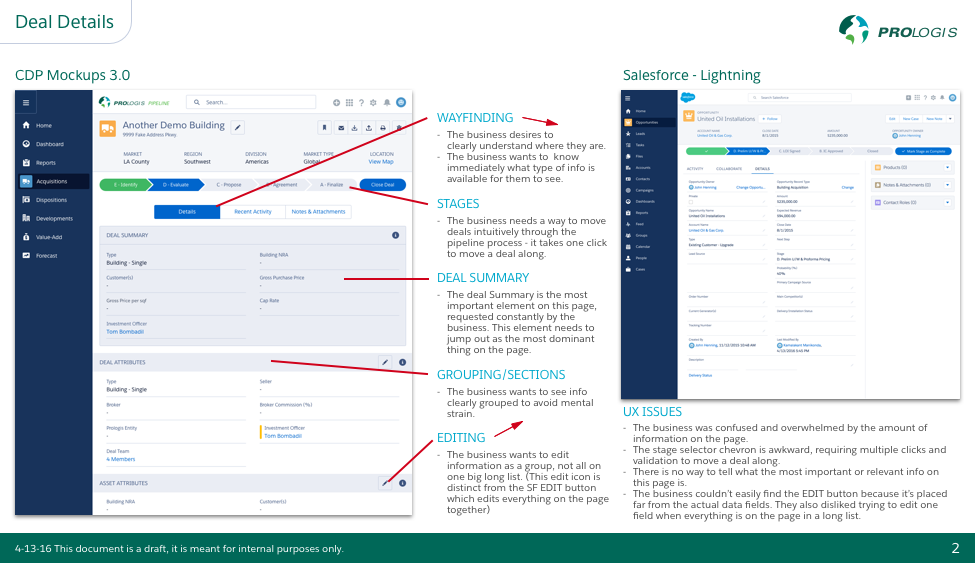
When we disseminated these mockups through the USA, we quickly became aware of important issues to solve (based on our Experience Principles) and solved them through thoughtful interaction and visual design.
-
Quick wireframes -

Sketch -> wireframes -> prototype

Global User Testing (with Interactive Prototypes)
Because real estate differs by region and country, once we had interactive prototypes we needed to watch a global user base ‘use’ this tool in their own environment to make sure we could accommodate everyone.
Validation methods: Design Exercises – collaborative creation User Validation methods (Talk Aloud, Eye Tracking, Ethnography/ contextual enquiries)
Pivot Point: Salesforce
-
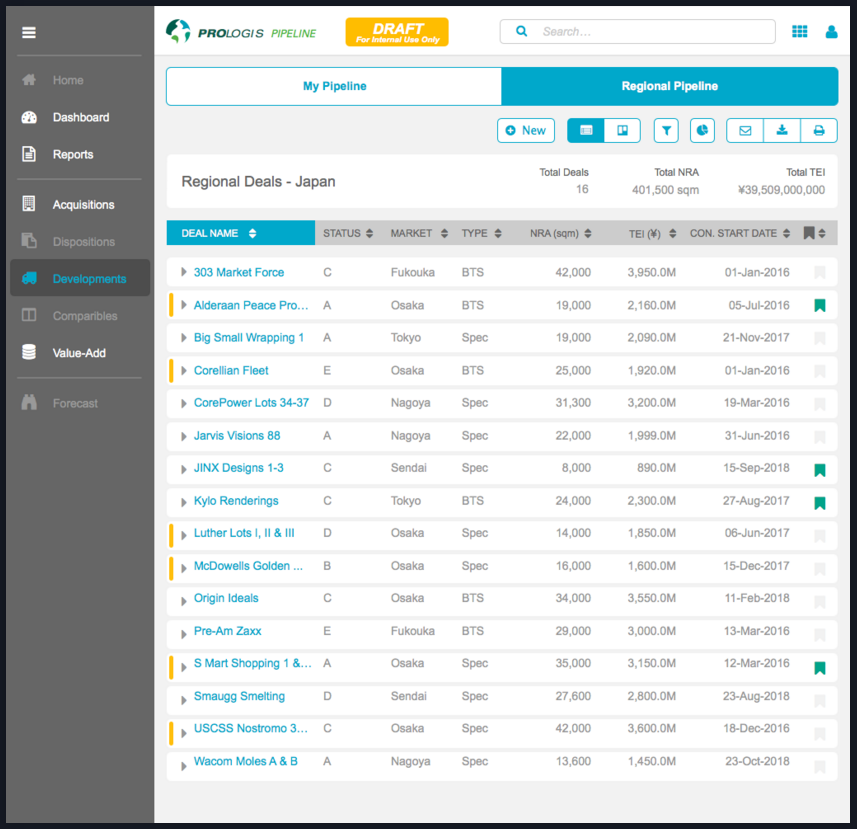
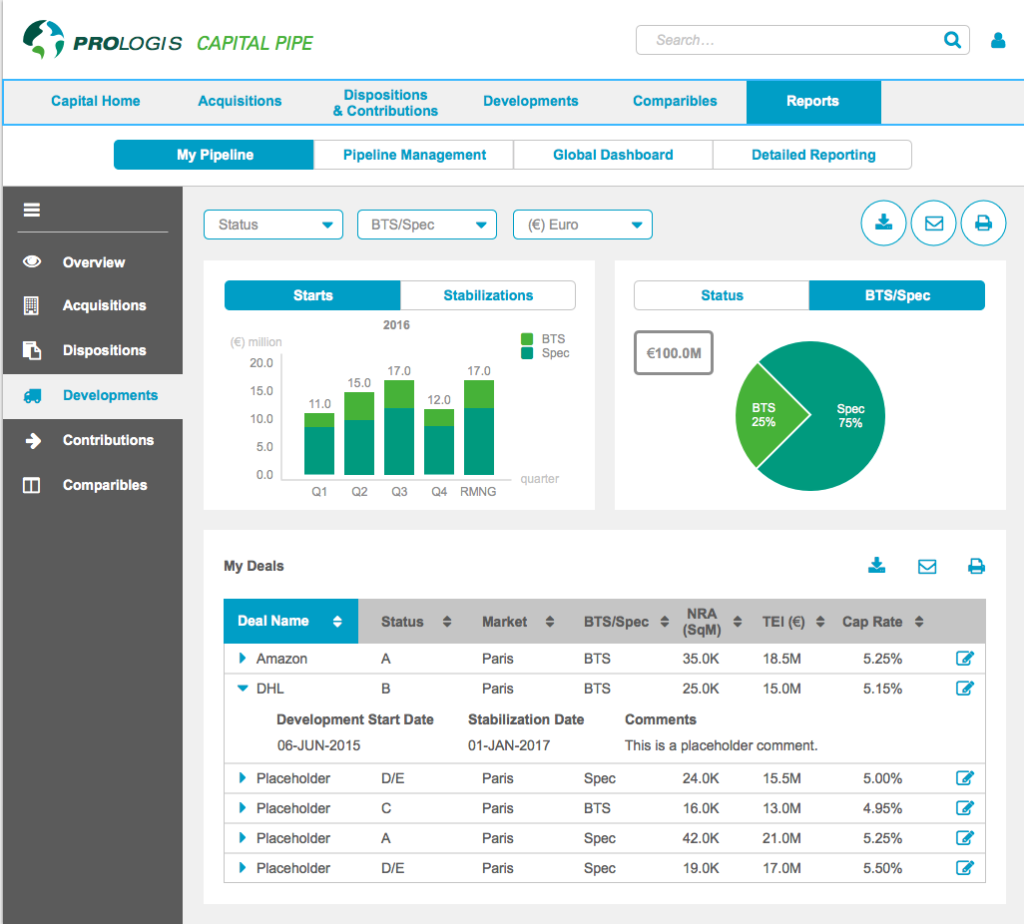
Original Prototype -
Our custom mockups transferred to Salesforce’s interface -
Salesforce interface -
Custom to Salesforce tradeoffs
As we started our global usability tests, there was a sudden pivot when the business decided to use Salesforce as the platform (instead of custom development).
This added a new level of complexity to the project, as there were now efficiencies in using Salesforce’s default interaction patterns.
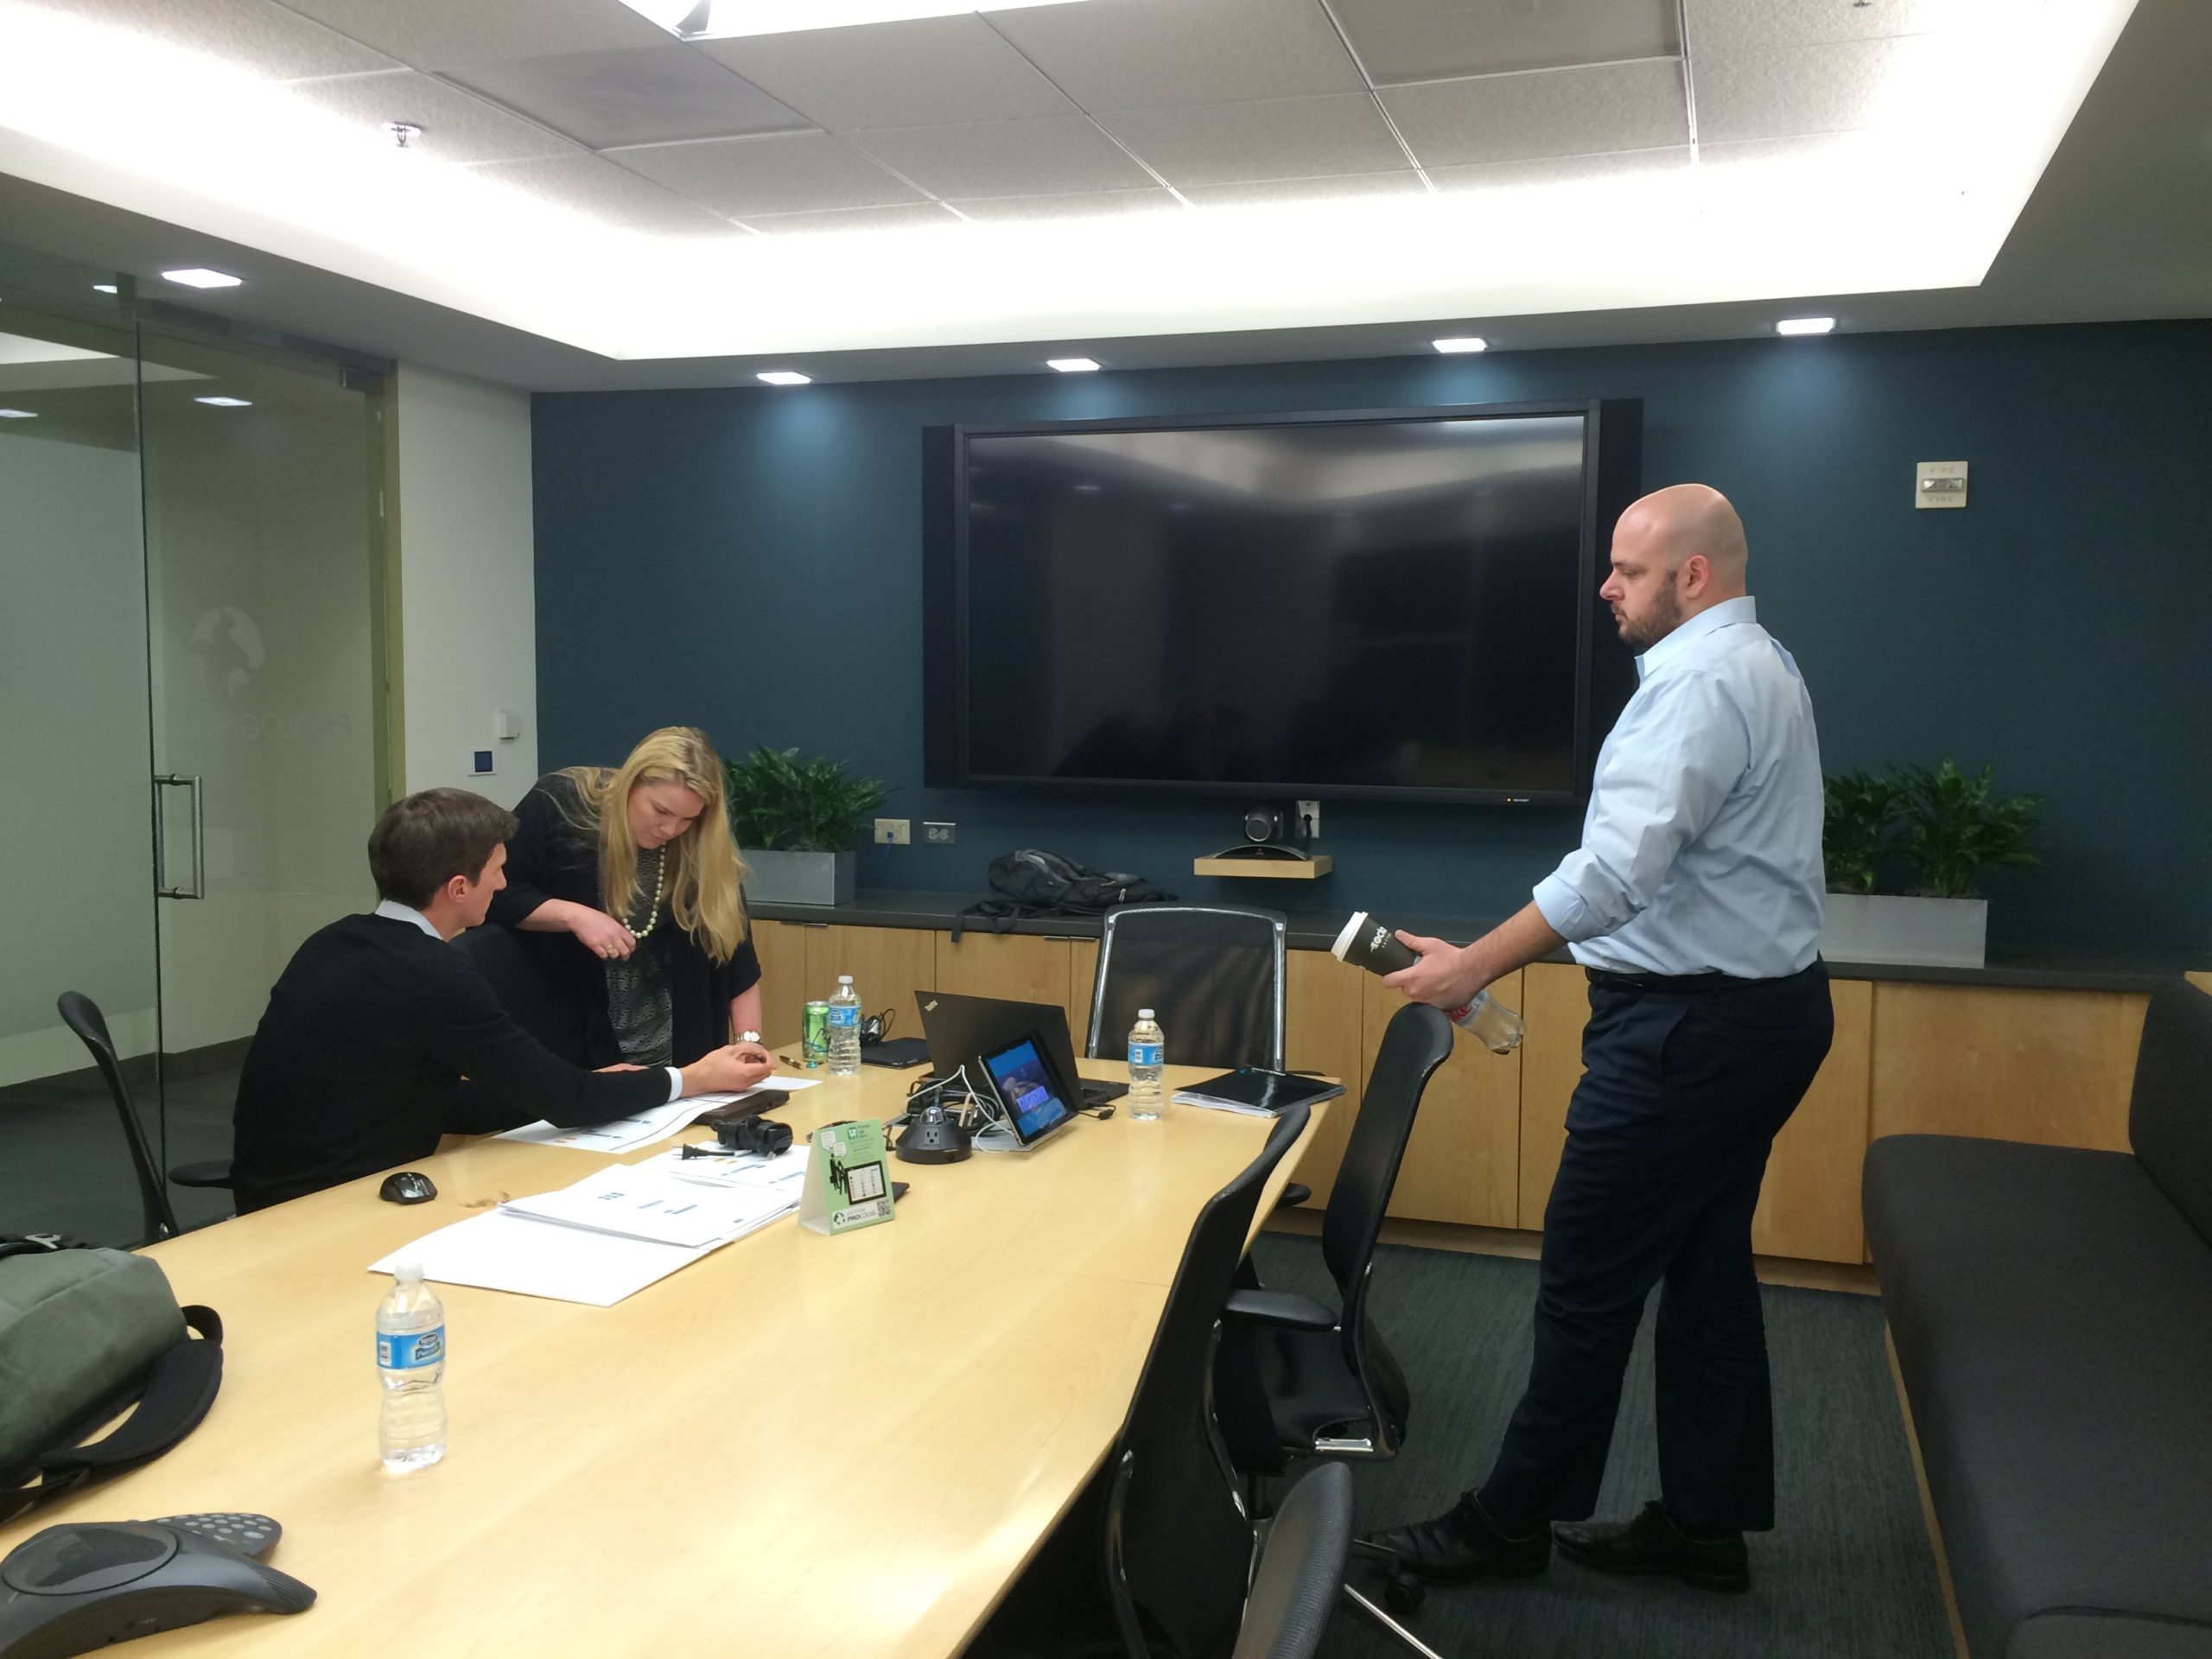
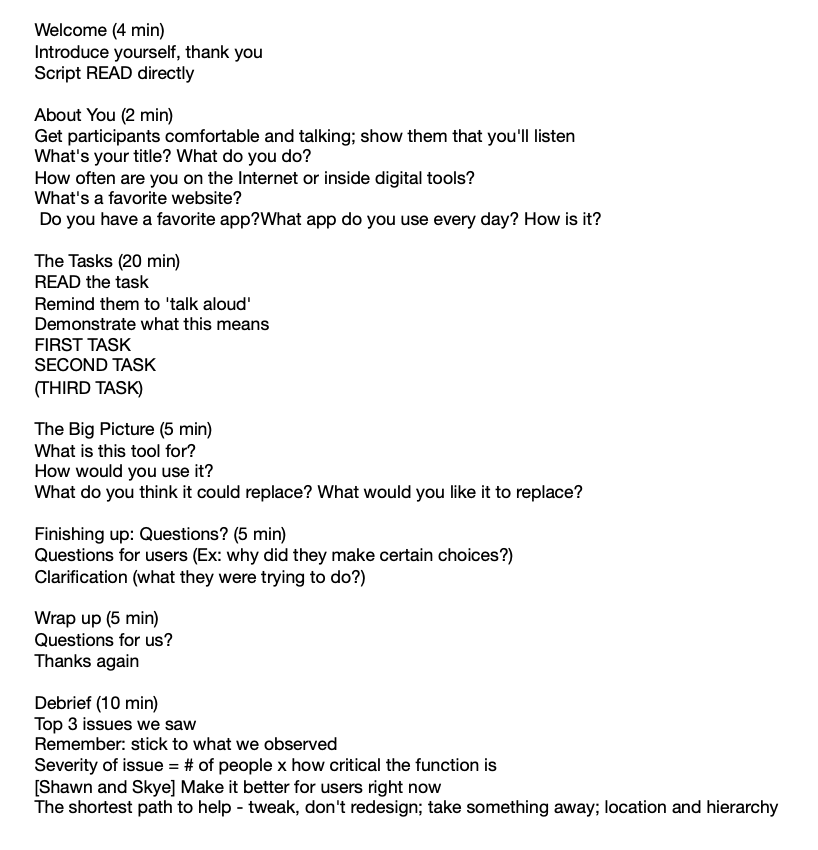
User Testing (Ethnography)
- On the top are some of the custom interactive prototypes per region (InVision)
- On the bottom, videos of users running through the usability tests (Lookback)
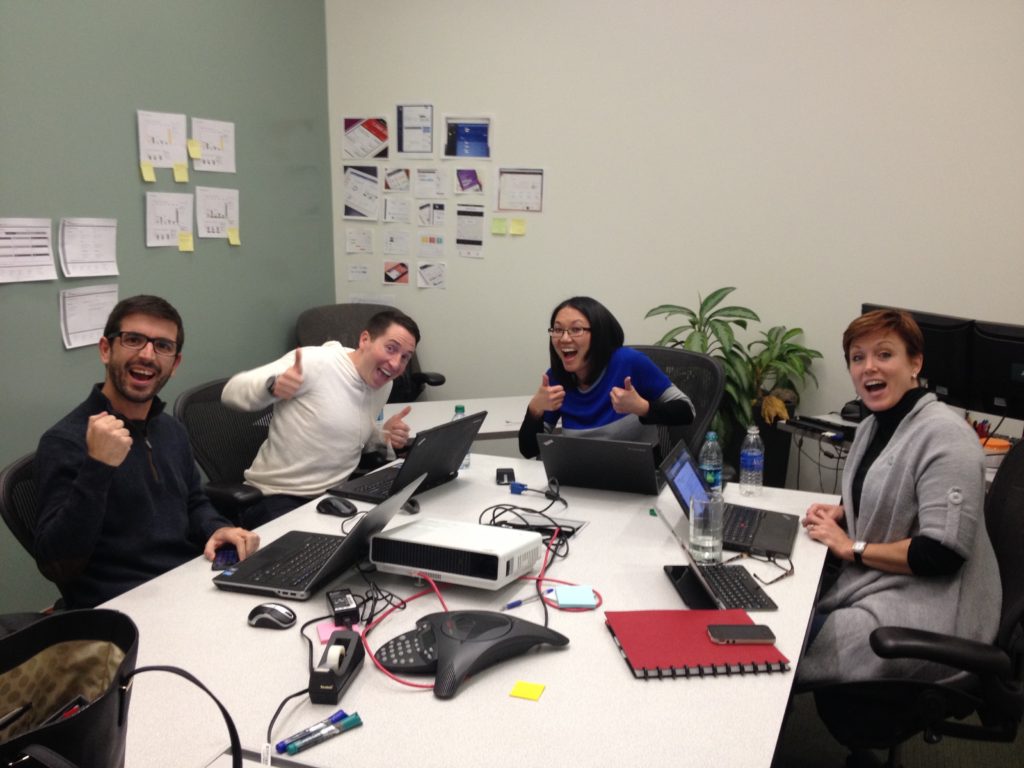
EXTRA: Traveling with Coworkers
Do not underestimate the value of positive, professional coworkers when working for two months straight around the world.


VISUALS
Screenshots – interactive prototype
Video – in production (user acceptance test)
EVALUATION
At this stage, we concern ourselves with
• Test (user testing)
• Measure (metrics)
• Assess (outcomes)
Overall Assessment: GOALS ACCOMPLISHED
In this company, I was allowed and planned for qualitative and quantitative testing. By every measure, we hit it out of the park.
- Create a tool to gather the info from the agents in the field and surface it in an ‘always up to date’ digital platform
- Make the Capital Deployment Pipeline (process & data) transparent to the business
- Make a tool by and for the field (user-centered)
- Success of user-centered/ agile design in this company

Ease of Use:
- Task Analysis
- Add a new deal
- iPad and iPhone functionality (+ bonus: ‘Offline Mode’)
Satisfaction (with the app):
- Survey
- Rated 4.52 out of 5
Increased Employee Productivity:
- [Calculated]
- Lower time on task
- Decreased error rate
- NO training time/costs
Process Improvement:
- Survey
- Rated 4.93 out of 5
| TEST | MEASURE | MIN GOAL | OUTCOME |
|---|---|---|---|
| Ease of use: top tasks (success + speed (1)) | Add a new deal <1 min | > 75% | 96% |
| Increased productivity (2) | Calculated | > 25% increase | 73% increase |
| Survey: Satisfied with the TOOL | Out of 5 | > 3.5 | 4.52 |
| Survey: Process improvement | Out of 5 | > 3 | 4.93 |
(1) Sample size: 223 people
(2) Calculated by the business, including aspects like time saved, less time on task, reduced error rate, no training costs
Team Satisfaction
| TEST | MEASURE | MIN GOAL | OUTCOME |
|---|---|---|---|
| Team+ satisfaction with the PROCESS (1) | Out of 5 | > 3 | 4.9 |
| Team+ satisfaction with the PROJECT | Out of 5 | > 3 | 4.7 |
| Budget | % of budget used | on budget | 94% |
| Timeline | Time used | on time | 2 weeks early |
(1) Sample size: 147 people
Other questions I would have liked to have answers for:
- How does this do in a heuristic review?
- How long do users stay in the CDP Pipeline tool on average?
- % use/total employee – and does this change over time?
- How much time is saved?
- How much more efficient is it?
- What errors are they seeing (if any)?
- Do they need to use Help?
- Retention and engagement
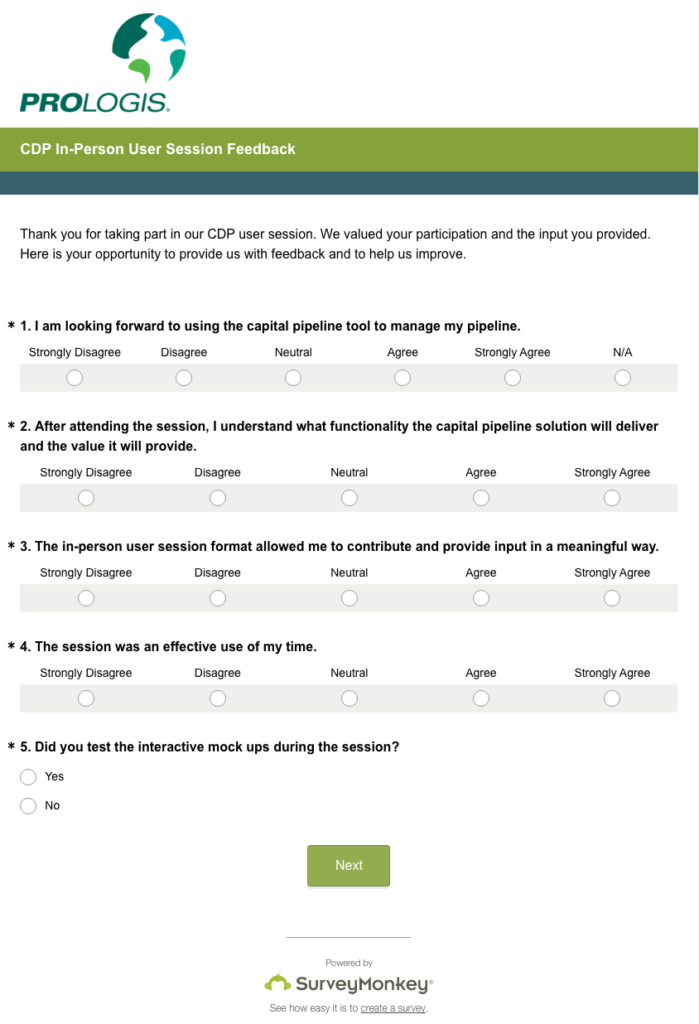
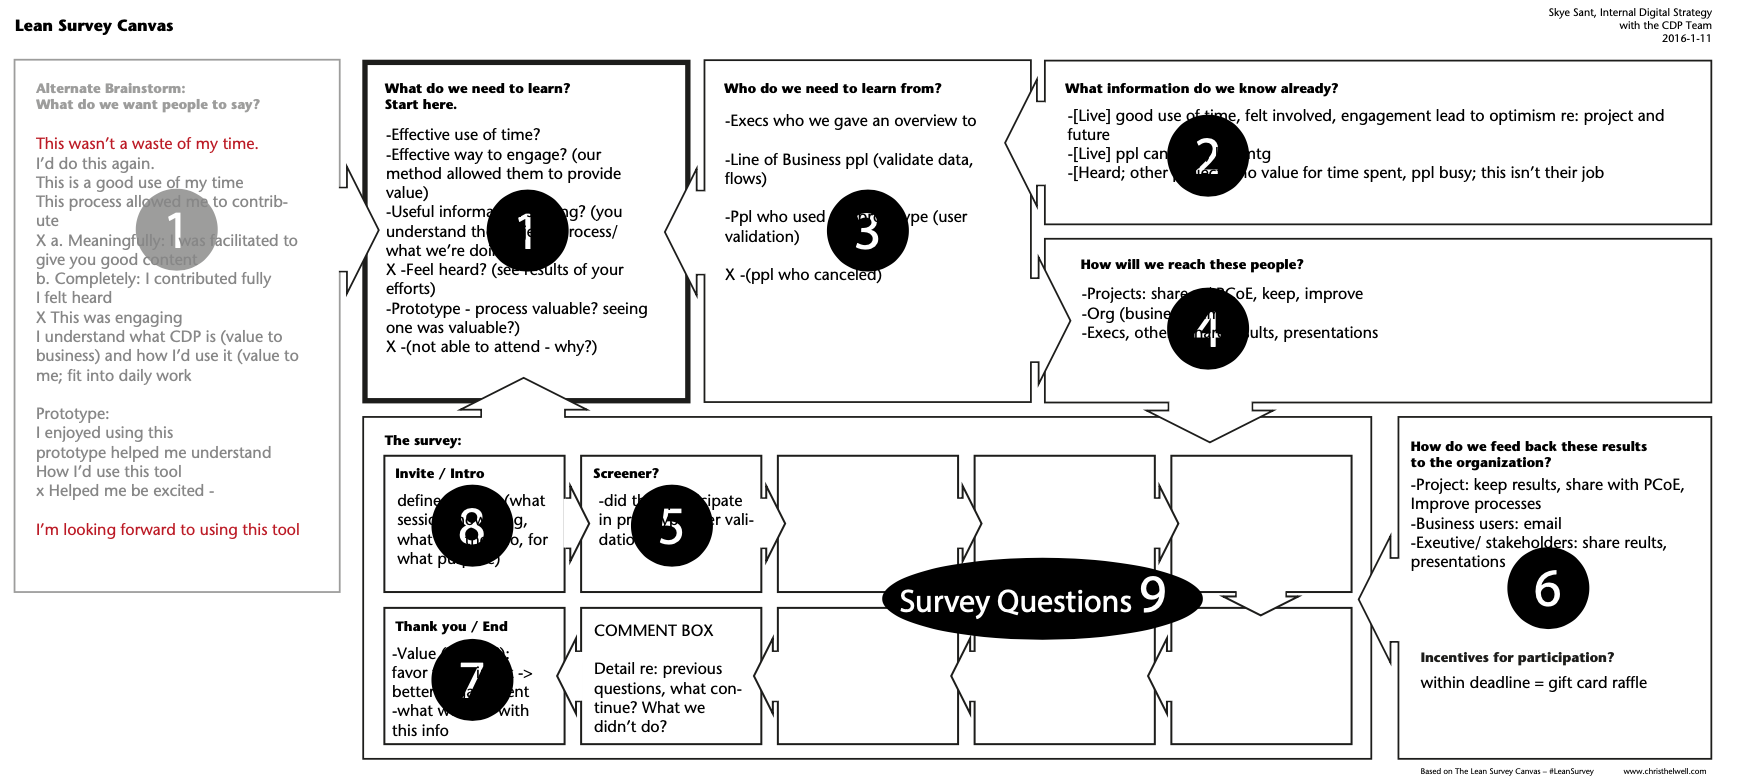
Surveys + Ethnography
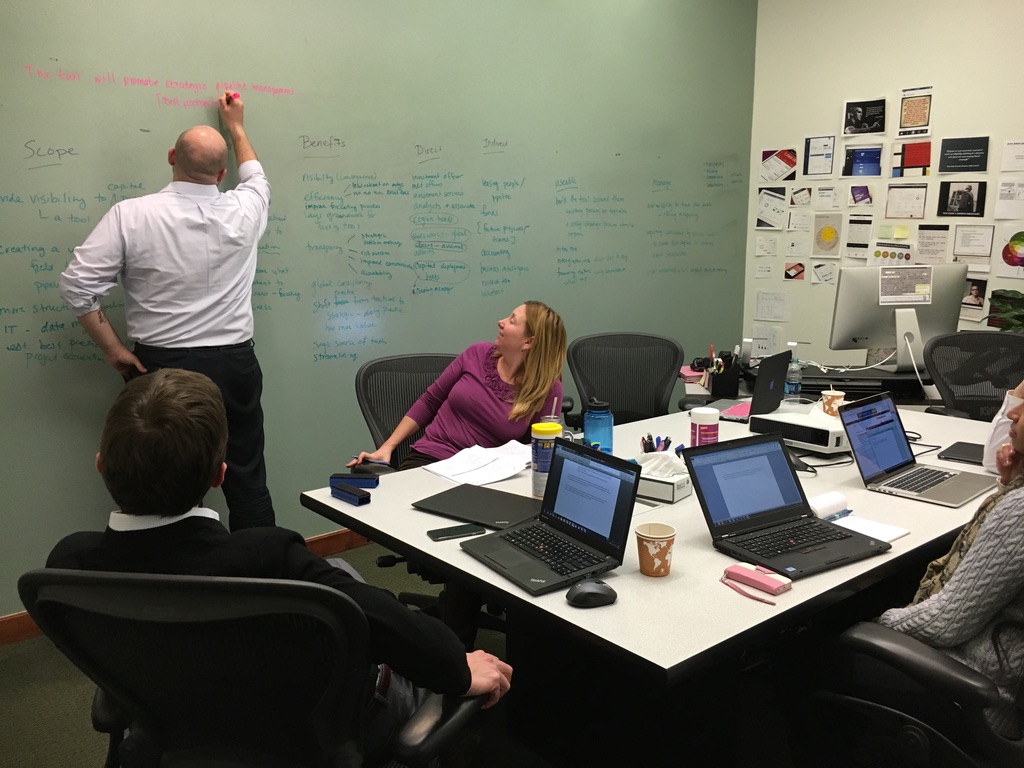
Being the only person with experience or qualifications to run user testing or ethnography, I trained whatever business people wanted to learn while I created the assets necessary. In the end there was a ‘team’ of 5 people to run tests.
-
Survey -
Teaching ethnography -

Lean UX Survey Canvas

EXTENSIONS
At this stage, we concern ourselves with
• Iterations
• Extensions (roadmap)
• Standards
• Documentation
• Communication/ Change Management
• Training (plan and deliverables)
• Help / FAQ/ Quickstart Guides
Iterations and Extensions
-
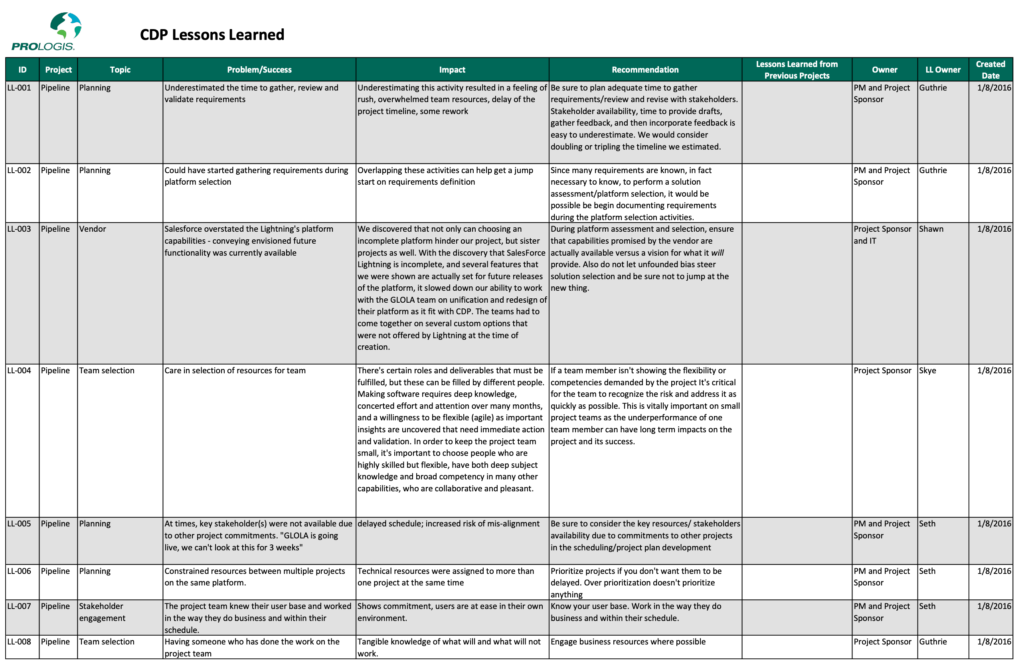
Retro: lessons learned -
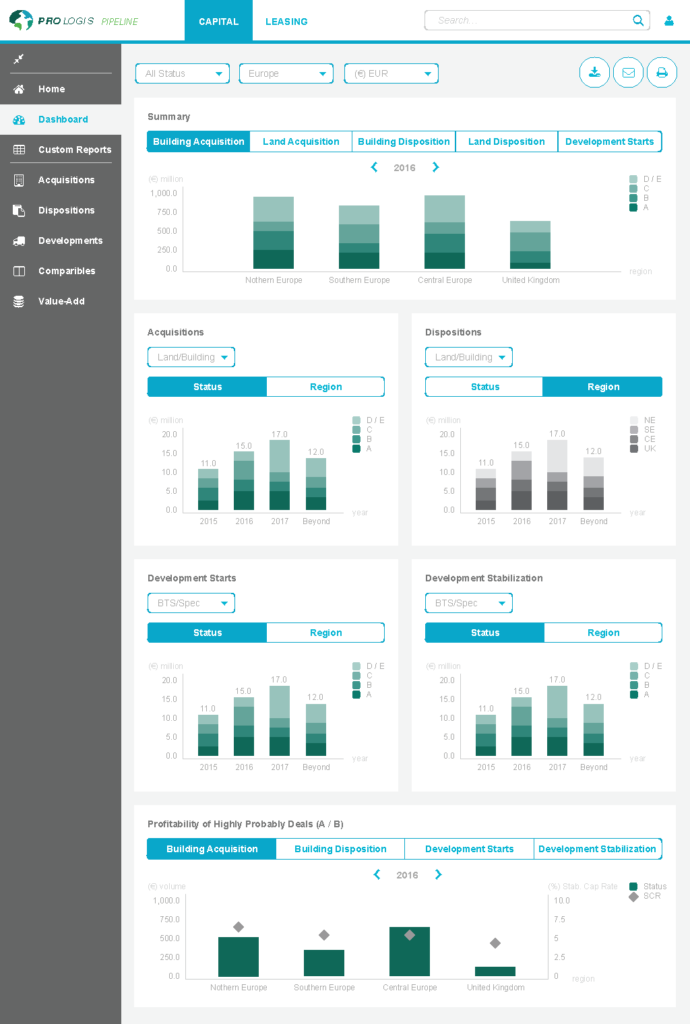
Dashboard roll up -
dashboard: personal 1 -
Dashboard: personal 2
-
Pattern Library -
Better billing -
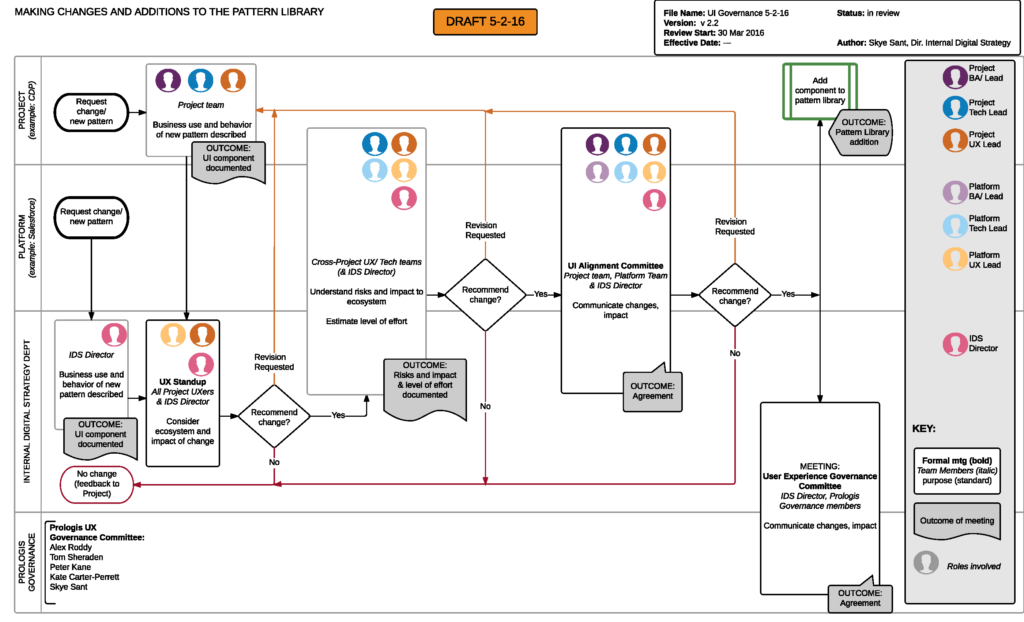
Workflow: pattern library change management
Iterations:
- Usability testing
- Tackle issues from Retro
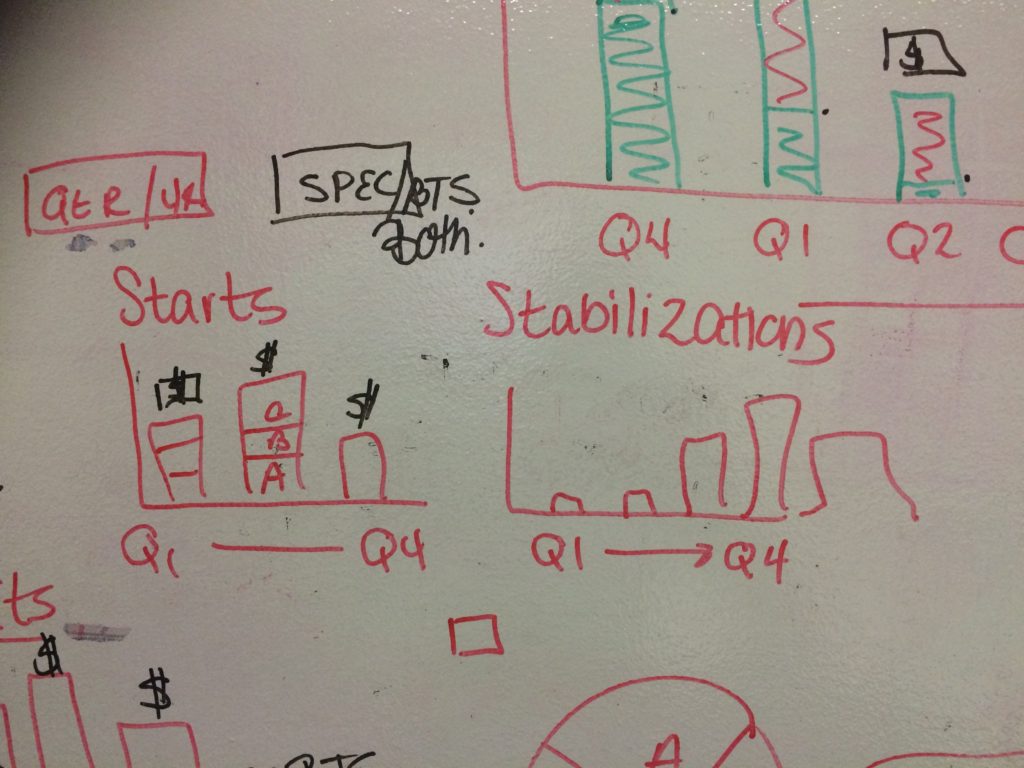
Thematic roadmap:
- Working into the future (Extended workflow, forecast functionality)
- Visualizing the state and flow (Dashboards)
- ADDITIONAL TOOLS TO EXTEND WORKFLOW
Supporting:
- Help/FAQ/quickstart guides
- Create standards
- Document All the Things
(Not pictured: Exec mtgs, ‘Training’ + rollout, change management, UX Dept wiki)
*Some assets under NDA
Outcomes + new North Star
- Outcomes:
- Increases business capabilities – the ability to forecast means the business can be proactive (not reactive)
- Employees feel impactful – see how they directly affect the company with their efforts and choices
- This platform gives the business coherent data, always up-to-date, and transparent at any time which increases organizational effectiveness and strategic decision making (eliminates pain points)
Lessons
- Global designs are complex and nuanced; many functions cannot be made ‘easy’ but they can be made clear
- User-centered design is win-win: everyone is happy to have contributed and delighted by the outcome
- Digital transformation in one area changes a whole company
Digital Transformation
The people working in the pipeline, and every project downstream, immediately saw the value of this real-time pipeline tool.
Processes that took weeks of back and forth sitting at a desk emailing spreadsheets now took moments inside a digital tool from wherever the business happened to be (including the Amsterdam airport). Meetings, inside a shared tool with up-to-date data, became intuitive and delightful.

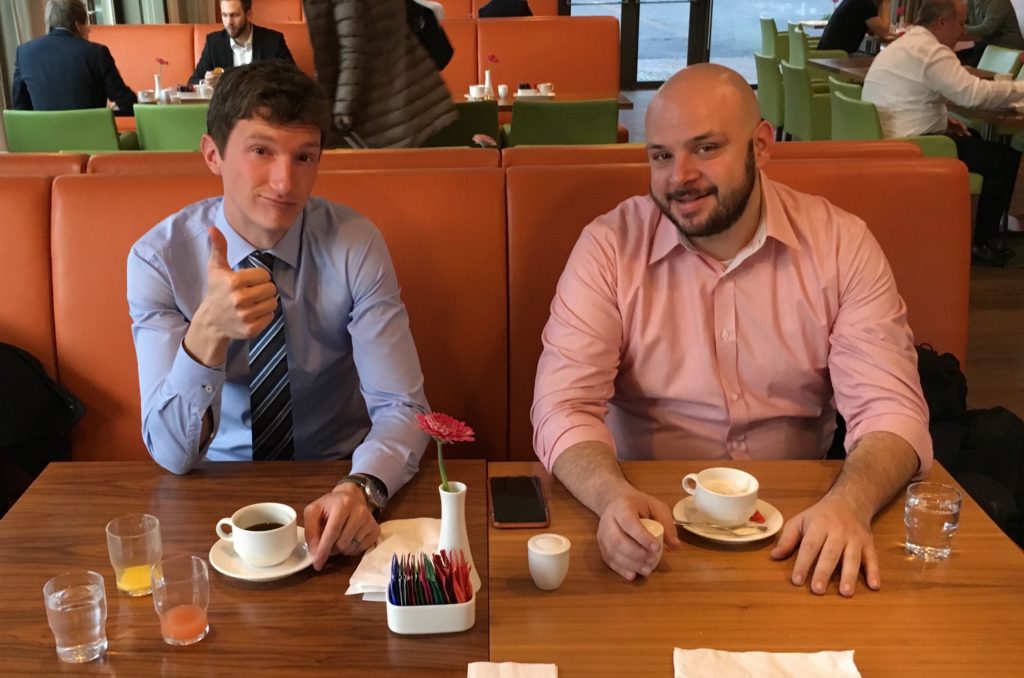
Digitally transformed: Business system owners reconciling the CDP pipeline in an airport in Amsterdam
People, Transformed
In addition to this successful user-centered project, the people involved with this test went on to be put in charge of many other projects. Currently, the company is going through a complete digital transformation, with all their internal tools switching to a user-centered development process.
A shared vision: people working together toward a user-centered goal, bringing meaningful products to customers and colleagues


People want to work this way. They want tools made this way – it’s the future.
I want to work this way too.