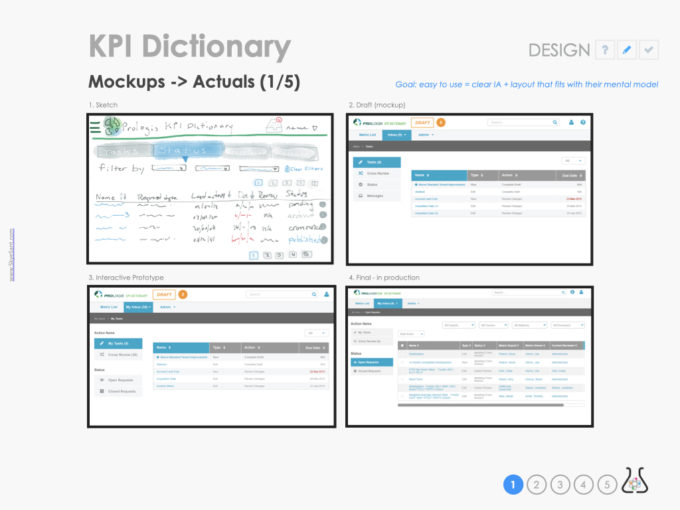
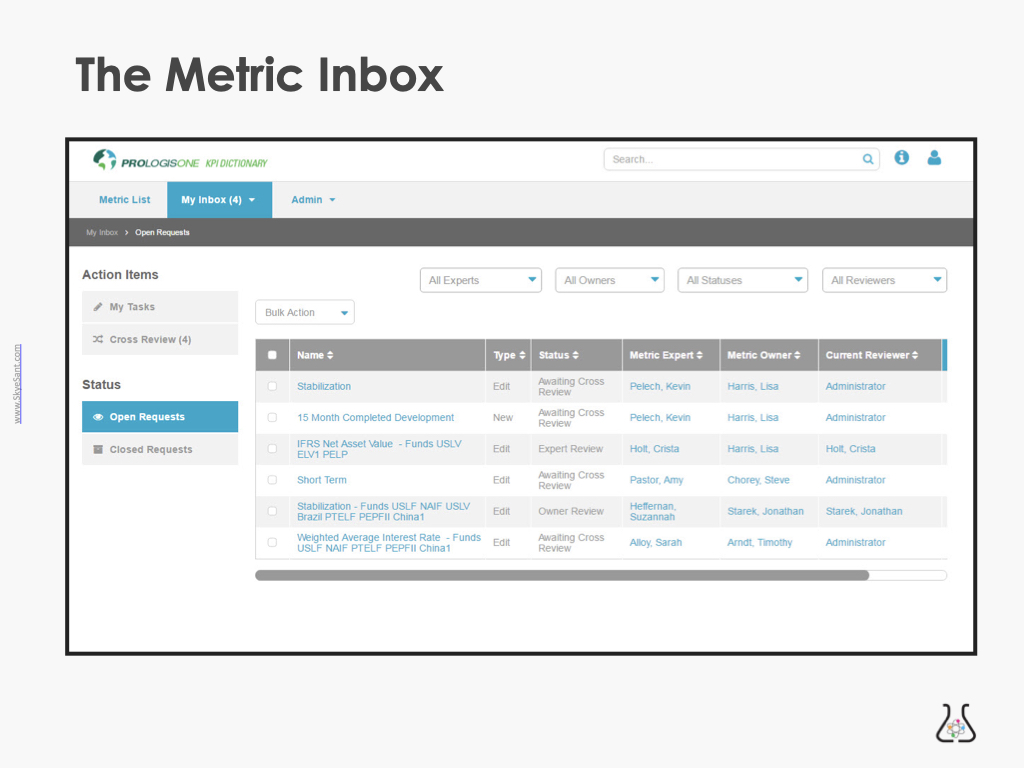
EXAMPLE: Sketch –> Production [Inbox]
The Metric Inbox is an example of the process involved in going from sketches to a final UI in production
Executive Overview
- COMPANY:
- This company is a large, enterprise, multi-national Real Estate (REIT) company with little digital/UX maturity
- ROLE: [Principal UX Designer]
- My Role:
- Informal Leader: Hired to pilot user-centered design in this company
- All facets of UX/Product design (user research, product design, user testing)
- Communicate to the business (strategy, vision, change management)
- Coach user-centered design (interviewing, user validation)
- Team: 5-person cross-functional team
- Dev team: 2 teams of 7 devs each (Portugal)
- My Role:
- ABOUT:
- The design changed on the main inbox page for Metric Owners, specifically on the internal menu and the page filters
- Legacy form: Spreadsheet updated manually
- GOALS:
- Overall: Manual spreadsheet –> digital tool with company-wide access
- Inbox: The Inbox design will match the user’s mental model – be easy to use and include relevant context
- SOLUTION:
- Validate: Using mockups, interactive prototypes, and an in-production MVP, we ran user tests to correct our designs to more closely match mental models, increase usability and work around technical constraints
- Evaluate (as part of the KPI Dictionary)
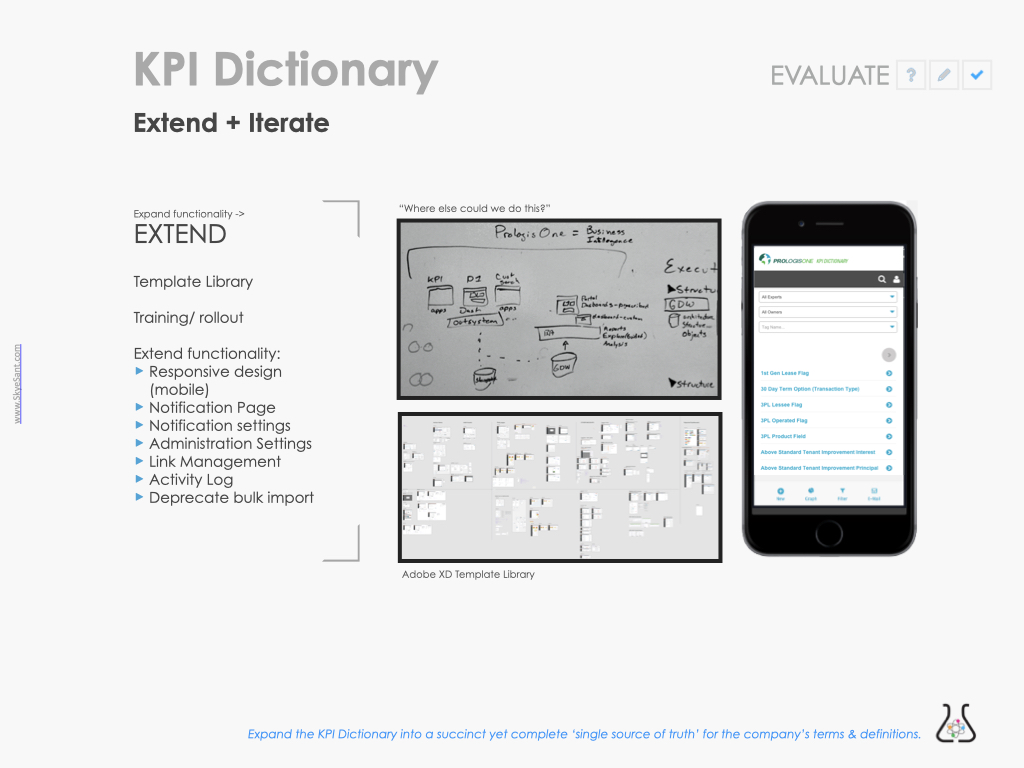
- Extend: next iteration, rollout, add to Pattern Library
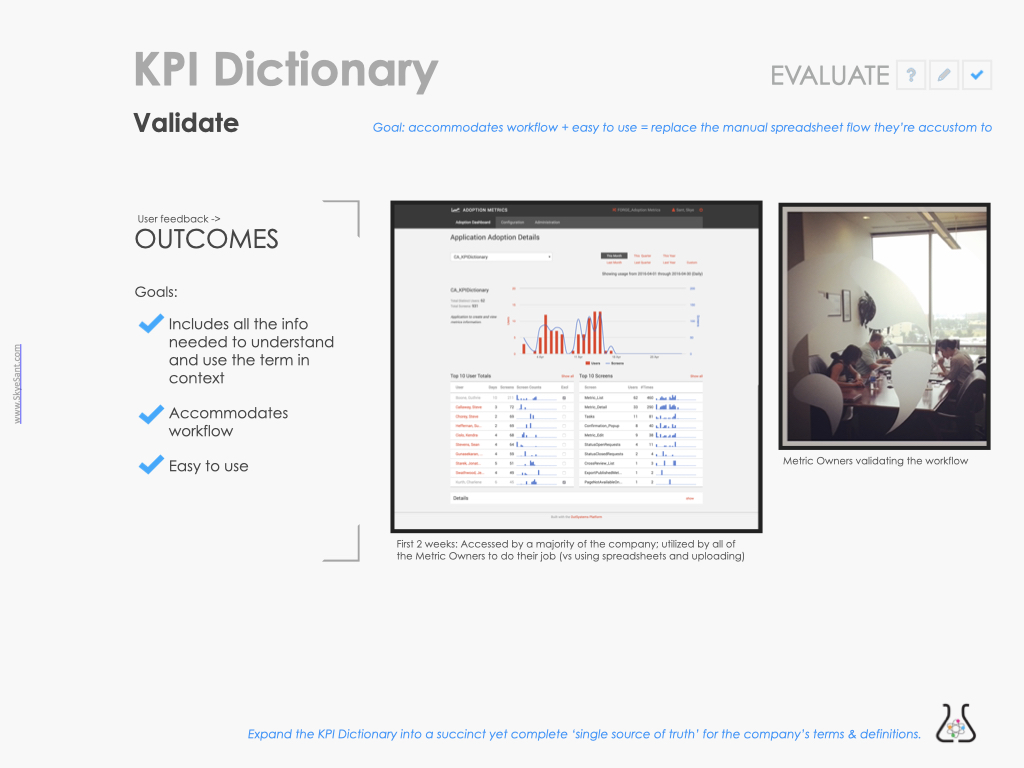
- OUTCOMES:
- Timeline: 4 months, under budget
- Evaluations (as part of the KPI Dictionary):
- 92% Success (accomplish top 4 tasks in <2 minutes)
- 88% YES; Includes all info
- Use in the first 2 weeks – 78% of the employees; 100% of the Metric Owners
- Outcomes:
- Digital locale that will embrace the metric community
- Fostering modern and mature Business Intelligence.
- Lesson: Real data in a UI makes a difference.
For more details, see each tab.
This is a sketch made after synthesizing the research data – the goal was to design a UI that matched the user’s mental models.
Though visually mapping the workflow and conducting interviews with the Metric Owners, we discovered there were 4 main types of activities that this Inbox would need to accommodate.
In this example, we see one activity: TASKS.
The overall goal was: The Inbox design will match the user’s mental model – be easy to use and include relevant context
For this page, the user goals were:
| User Need | Feature/page |
|---|---|
| Allow me to see what I need to do | List, specifically a table |
| Allow me to see what I need to do soon/ for a specific person/ for a type of request etc. | Sort |
| Help me focus on just what I need to get done now/ in a certain case | Filter |
| [Secondary] Show me everything I HAVE to know and hide the rest but make the other information available to me | – see ‘Linked Metric’ – info icon |
| [Secondary] I’ll likely be on an iPad | Tablet-first design |
Sketch
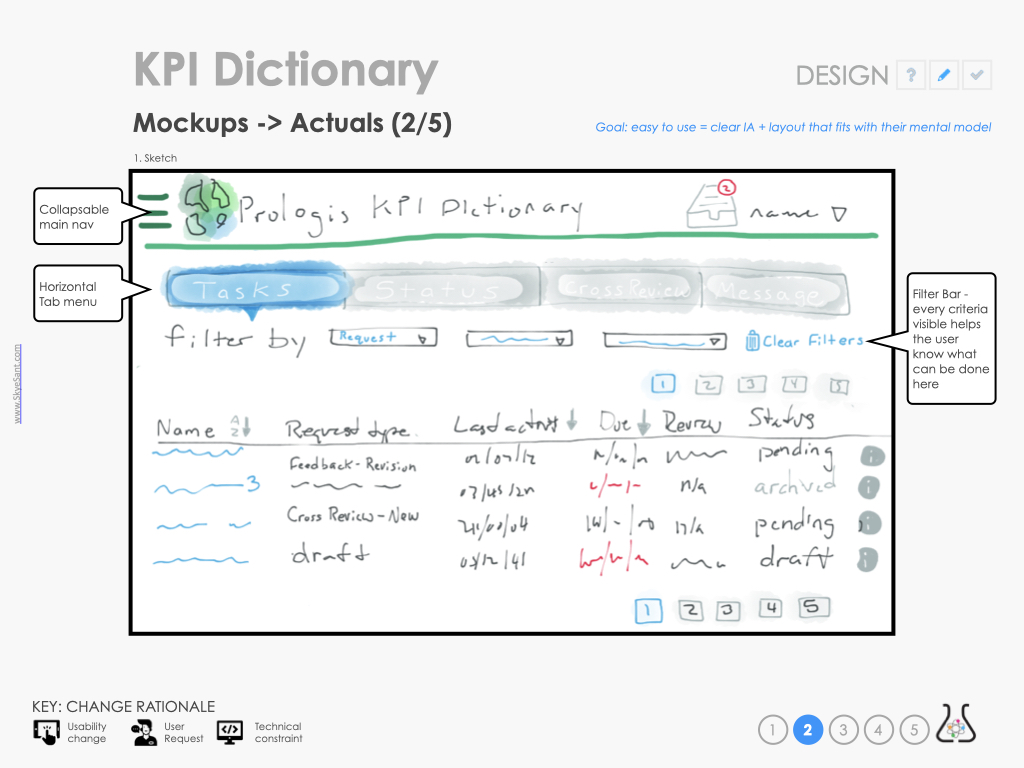
– The main nav is collapsable to keep it out of the way – the functionality is limited so no primary need for global nav.
– The horizontal menu of the types of activity changes the content under it
– And the filters, always visible, make clear what can be filtered for.
Mockup
After watching 12 Metric Experts ‘use’ the sketch mockup, we changed things around to be more intuitive and easy to use.
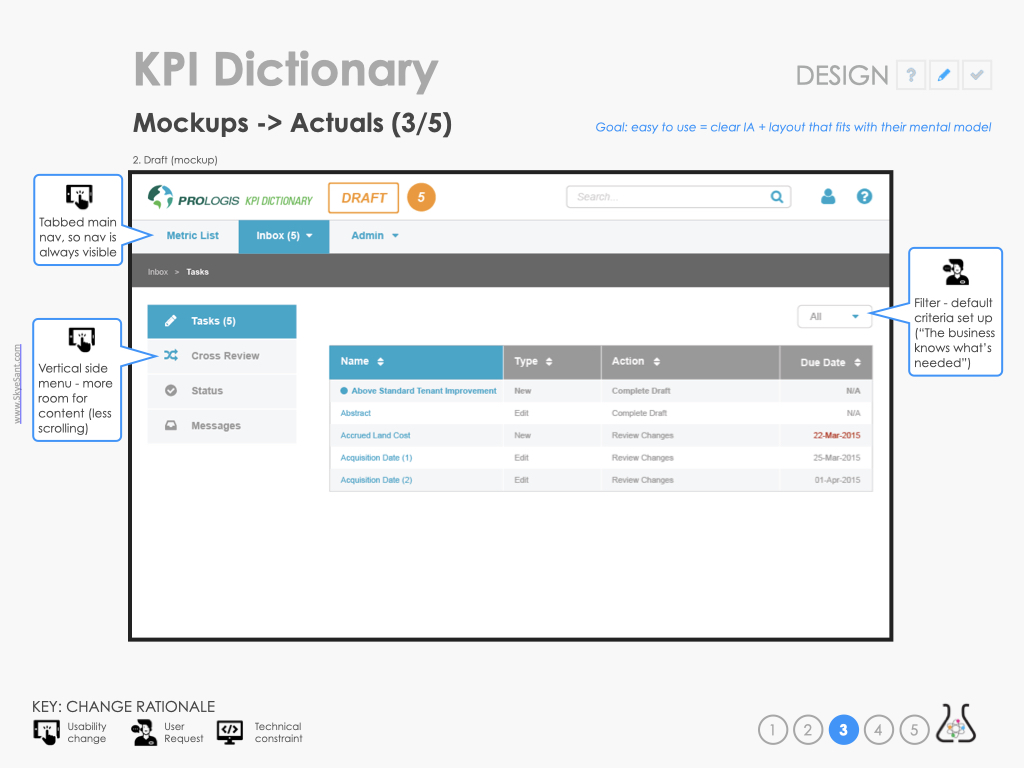
– The horizontal menu changed to a vertical side menu to avoid a double row of menus up top and allow for more visible rows on the table
– The 4 types of activities were moved from a horizontal to a vertical menu to match an existing pattern
– Via a request from the business, the filters were gathered into a pre-set series of options in a dropdown. This limited flexibility but took up less real estate
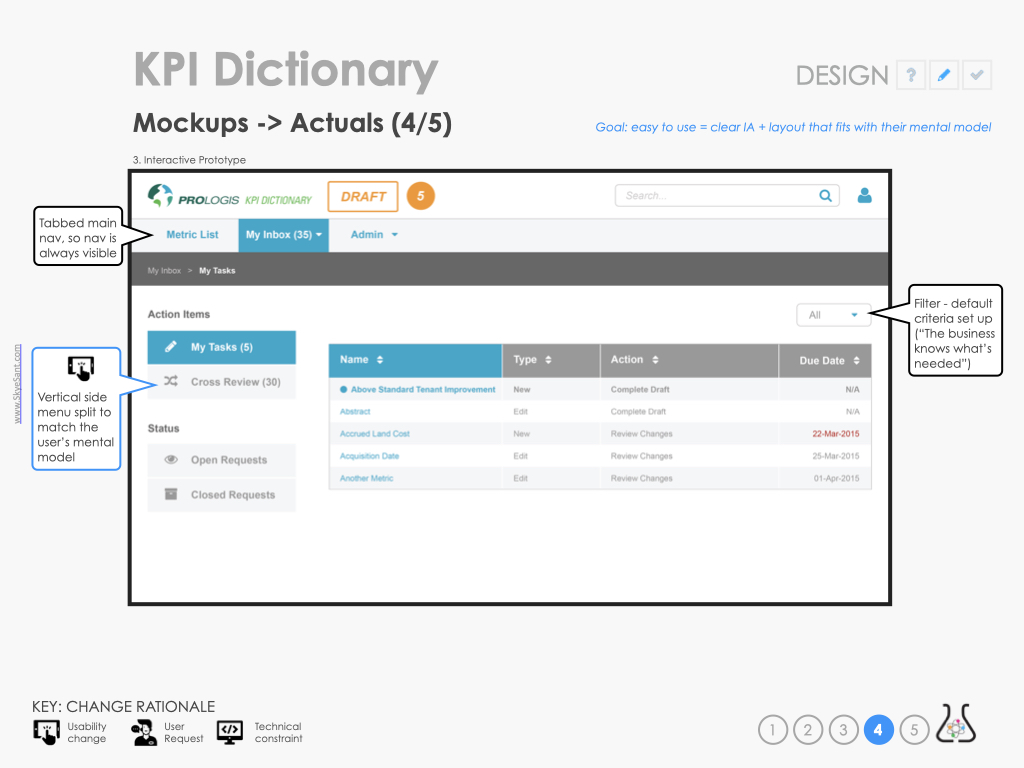
Prototype
After watching an additional 8 Metric Owners use an interactive prototype, we changed things around to more closely match the user’s mental model for the functionality included on the Inbox.
In Production
At this point, an MVP was built and there was one additional round of user feedback which included all the Metric Owners.
There was one final change, given real data and a run-through of their workflow on a real system – robust filters.
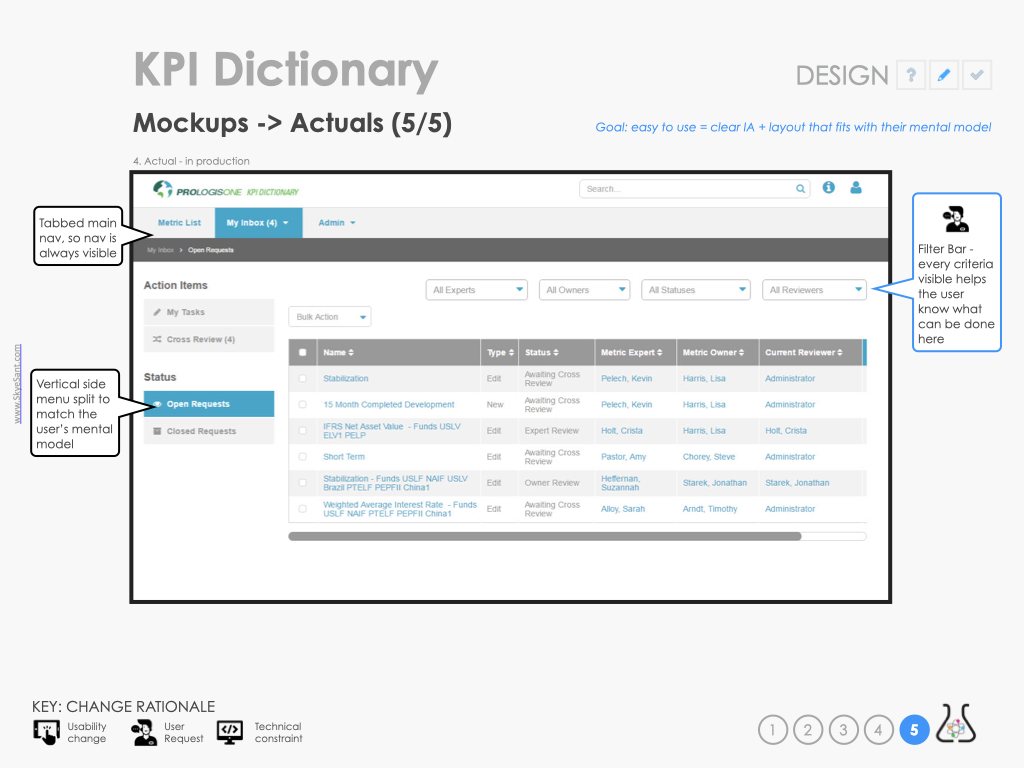
– Given large amounts of actual items and a real workflow to get actual jobs done, most of the Metric Owners asked for more robust filters back.
Inbox Goal: The Inbox design will match the user’s mental model – be easy to use and include relevant context
EVALUATION
At this stage, we concern ourselves with
• Test (user testing)
• Measure (metrics)
• Assess (outcomes)
| TEST | MEASURE | MIN GOAL | DATA |
|---|---|---|---|
| Quantitative Test: success + speed (1) | Accomplish top 4 tasks in <2 min | > 75% | 92% |
| Qualitative Test: sufficient context? (2) | “Do you have all the info you need to do your job, here?” | > 75% | 88% YES |
| Analytics: use | Employees accessed the tool in the first 2 weeks Metric Owners accessed and used the tool in the first 2 weeks | > 25% > 50% | 78% 100% |
I assessed whether it was at least as usable as the old method (of passing a spreadsheet) by looking at usage data.
Most of the business accessed this tool in the first 2 weeks and ALL of the Mertic Owners immediately started using it heavily.
I was responsible for the rollout through the business to make sure everyone was aware of this new tool. And, for the design and engineering team, we made sure to codify what we’d made into templates and patterns in the Pattern Library.
For the KPI Dictionary as a whole, we added more functionality, more workflow, and pushed a mobile design into production.
To see more details on the KPI Dictionary or Evaluate/Extend, see Iteration: The KPI Dictionary