SYNOPSIS: KPI Dictionary (database + workflow)
As Prologis’ first Director of Internal Digital Strategy, I designed and oversaw the creation and deployment of Prologis’ online internal KPI Dictionary.
The KPI Dictionary is an online site/tool containing the approved definitions of metrics and key performance indicators for the company as a whole. Because no such system existed before this, we focused on making entries truly useful by giving all necessary context without overloading the person looking for understanding. Because of the alignment and collaboration necessary across all departments and roles for company-wide adoption, we designed very thoughtful workflows for creating, editing, approving and deleting entries.
This is a summary; for more in-depth details, please see KPI Dictionary case study (Link)
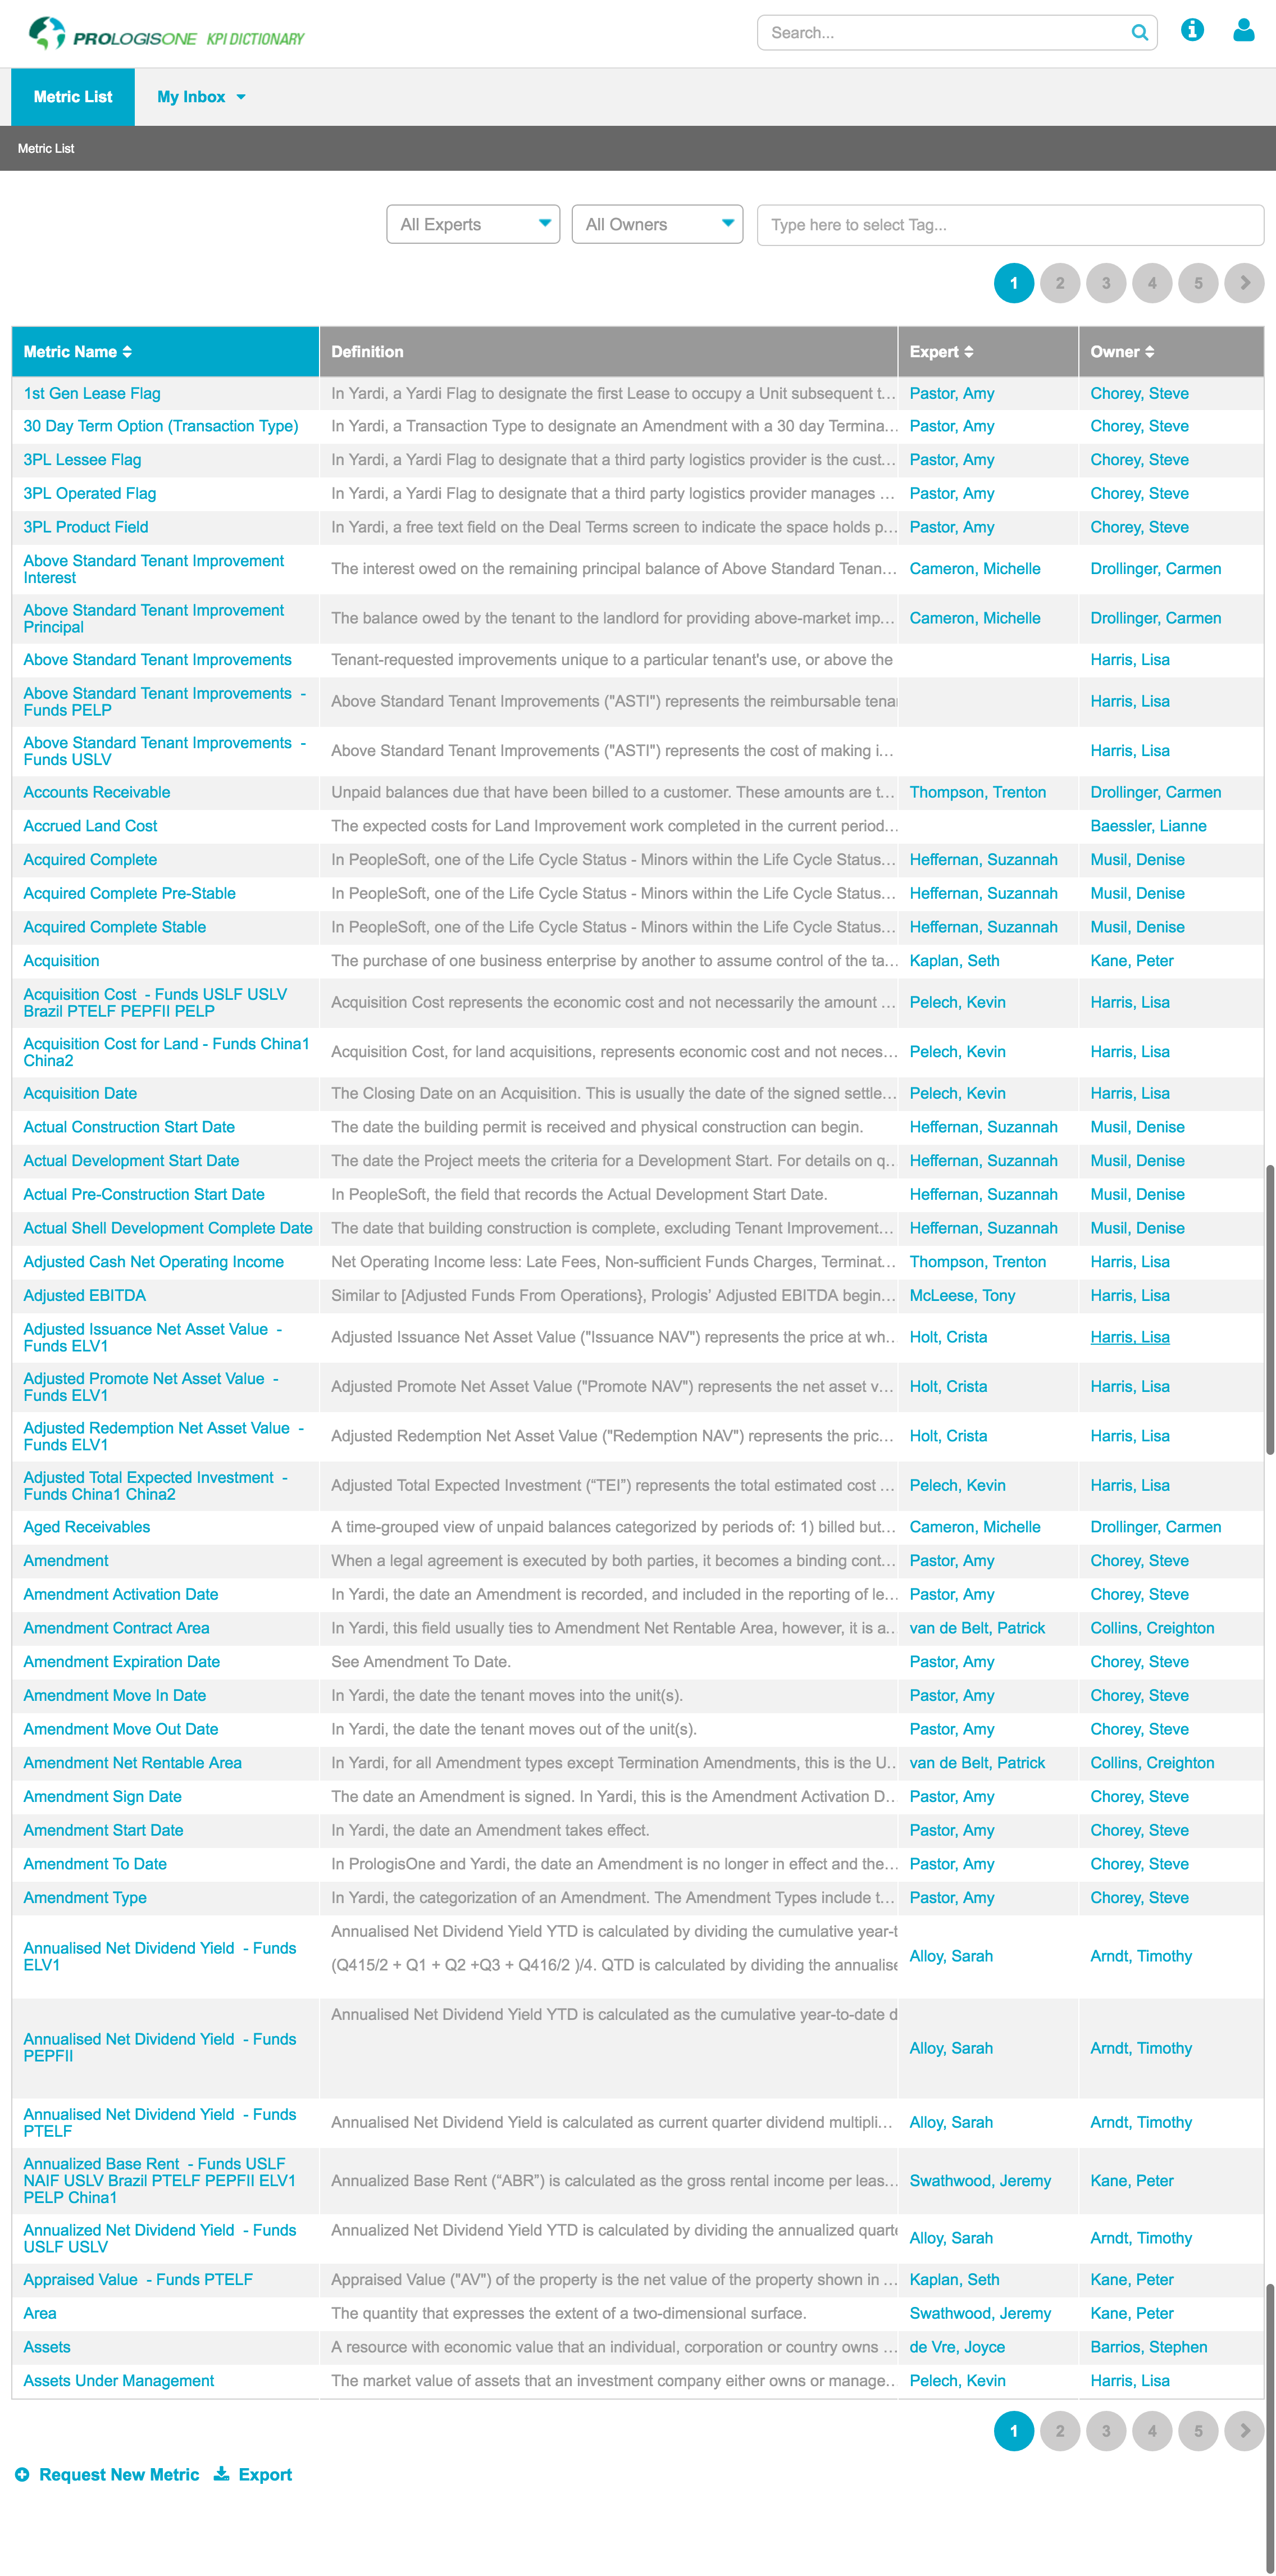


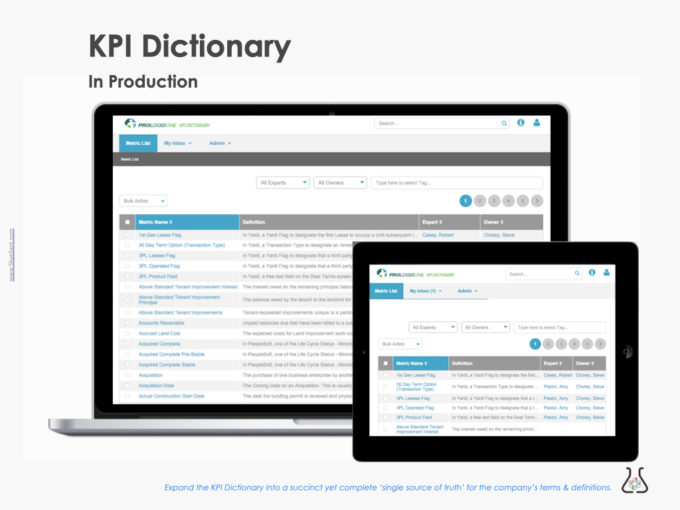
Key Performance Indicators and company metrics, defined and searchable
Hover over to scroll content
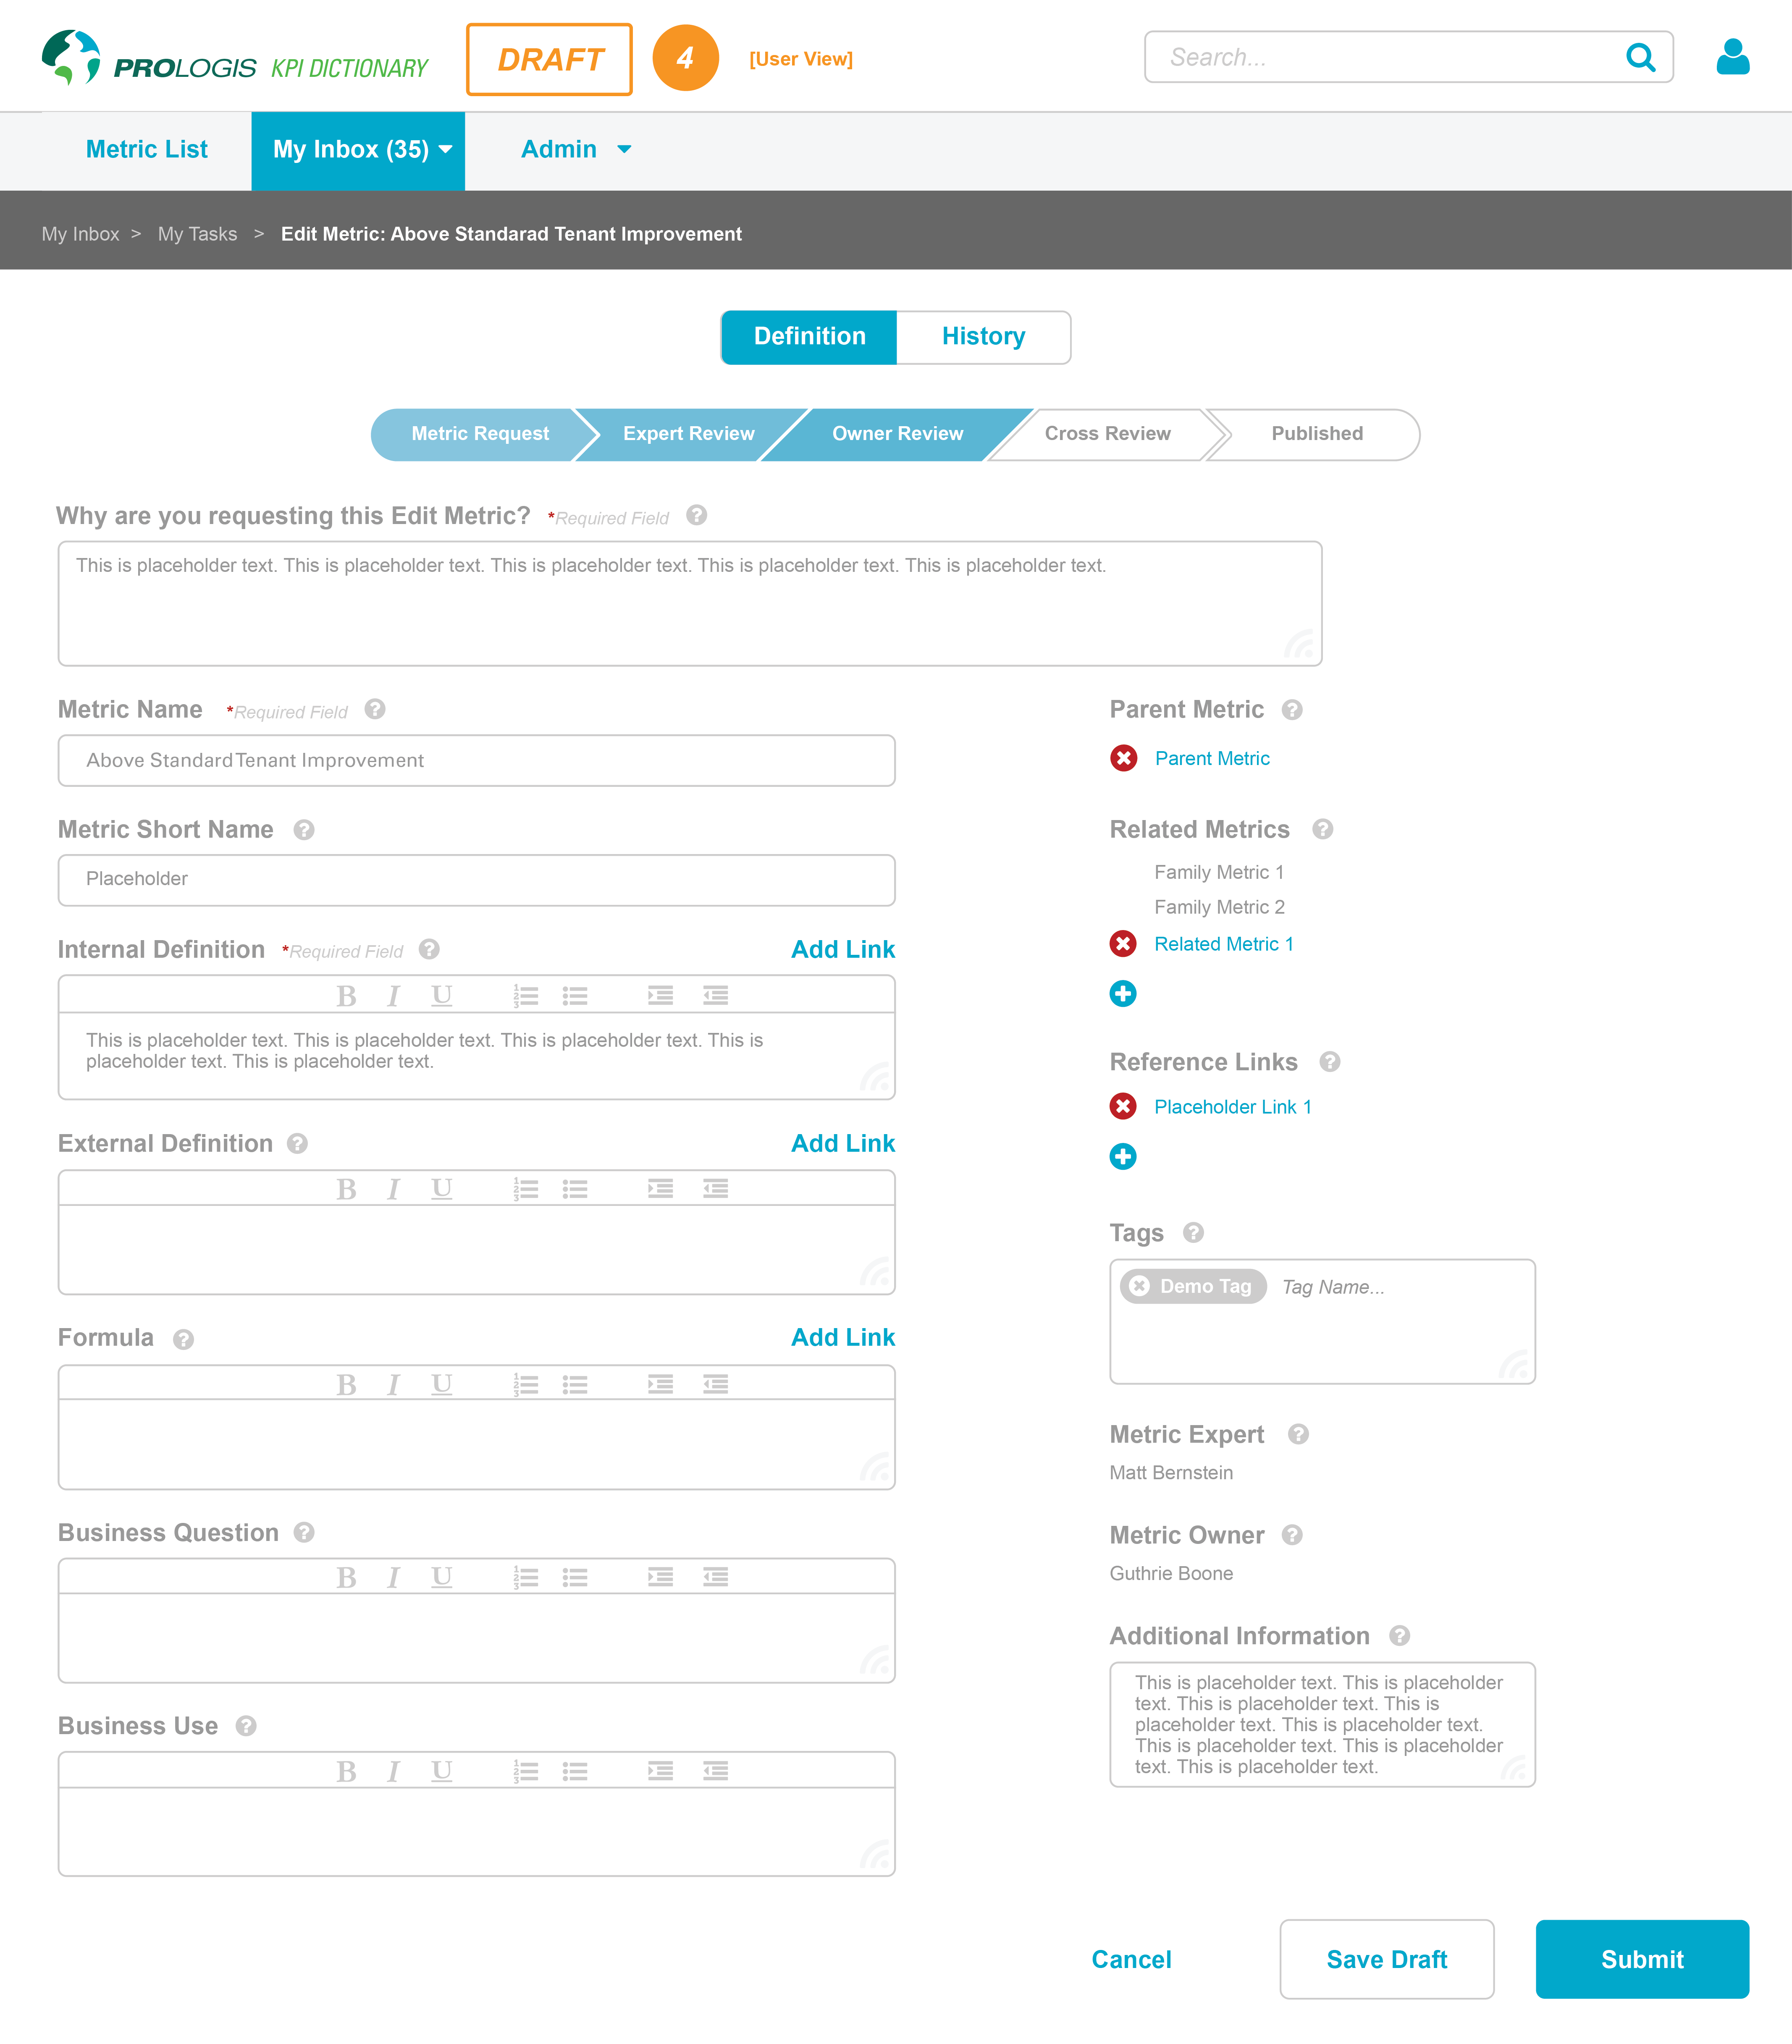
A thougtful workflow for creation, approval and change
Hover over to scroll content
This internally-focused project involved:
STAGES
- User Research
- Product Strategy
- User Journeys
- Process Mapping
- Information Architecture
- Iterative Wireframes
- Prototype (interactive)
- Prioritized Roadmap
- User Testing (validation)
- Multiple Presentations to Stakeholders
TOOLS
- User Research/ Interviews
- Android HIGs
- pattern library (created)
- Illustrator/Photoshop/ InDesign
- Sketch App
- Annotated Wireframes
- InVision App (Interactive Prototype)
- LucidCharts
- PowerPoint
- JIRA (development)
CONTRIBUTIONS
(as in-house Director of Internal Digital Strategy)
- UX/Product Strategy: Skye Sant, Rachael McClellen
- BA/ Market Research: Guthrie Boone
- User Research: Skye Sant, Shawn Jenkins, KPI team
- Illustration: Skye Sant
- Interaction Design: (Skye Sant) Shawn Jenkins
- UI Design: (Skye Sant) Shawn Jenkins
- Visual Design: Shawn Jenkins
- Product Owner (user champion):Guthrie Boone
BACKGROUND:
It was the PrologisOne dashboarding team that fully realized that each business unit was using – sometimes together, in a single document – multiple conflicting definitions of critical functions, metrics, and KPIs. Previous to this initiative there was little collaboration to reconcile these inconsistent metrics; indeed, there was no way to even know that a metric existed in another form inside the company.
The ‘KPI Dictionary’ started as a spreadsheet list of Key Performance Indicators but evolved into a huge list of terms across the whole company kept in a giant spreadsheet updated manually by Charlene. Any questions, additions, or deletions went through her, and a lot of terms were missed.
MANDATE:
The Head of Operational Strategy initiated this project with a quick timeline as a test case of our team’s agile abilities: what digital tool could we create to solve this problem of ‘inconsistently defined metrics’, in 4-5 months, that would be a minimum viable product adopted by the entire company?
GOALS:
- Manual spreadsheet –> digital tool with company-wide access
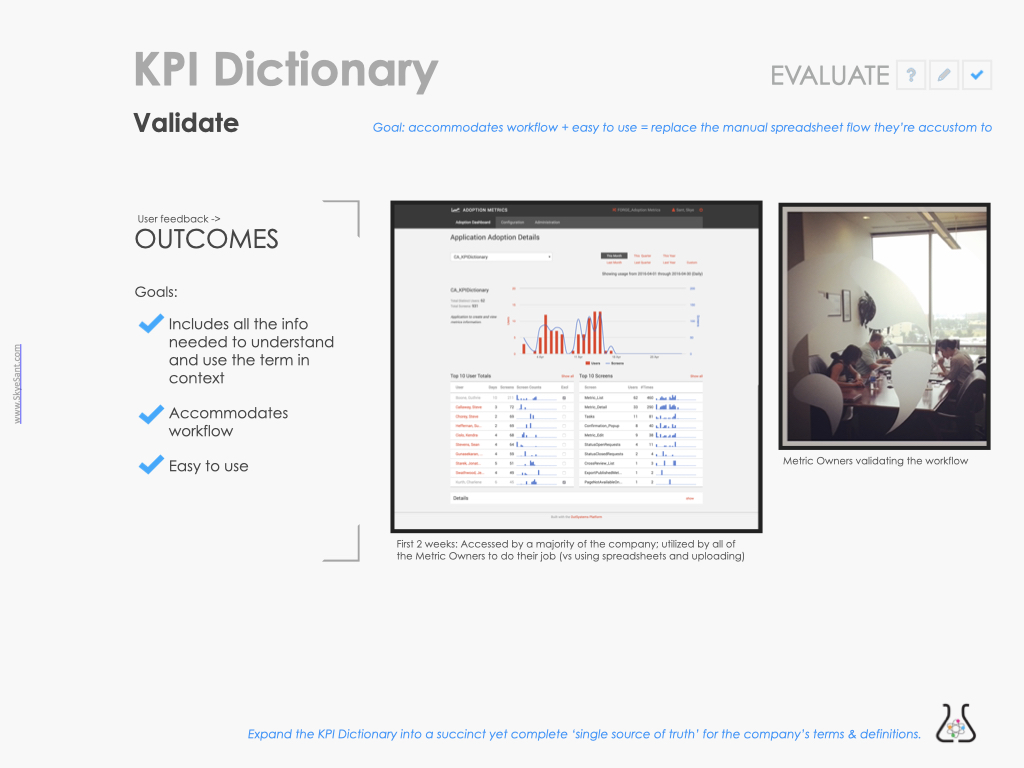
- A single source of truth: Includes all the info needed to understand and use the term in context
- Accommodates workflow
- Easy to use
OUTCOME:
We more than succeeded, creating not only the single source of truth, a searchable online library of metrics, but also a cross-discipline, multi-departmental method of creating, editing, approving, and deleting metrics that is the process by which the company functions to this day.
PROCESS:
- Discover
- Content audit (what we had), SME interviews (what we needed),
- Prioritization and structure of components/pages (‘Context of use’)
- Synthesize workflow, information architecture, and mental models.
- Design
- Visual + interaction design
- sketches > mockups > prototypes > build
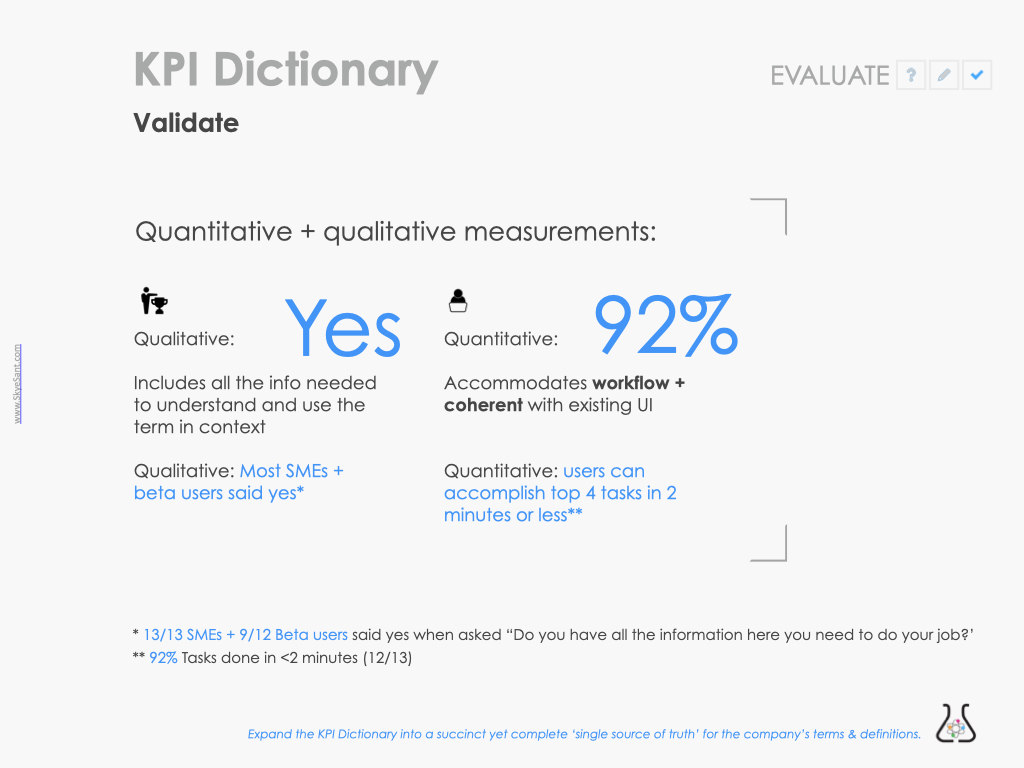
- Evaluate
- Validate via user testing, interviews, usage metrics
- Extend & Iterate
- Prioritize additional pages, employee training, create Pattern Library
- (Related: Training team for user research, Stakeholder design exercises + meetings, vision + strategy presentations, user stories, Agile methodology, change management)
- GOALS:
- Manual spreadsheet –> digital tool with company-wide access
- A single source of truth: Includes all the info needed to understand and use the term in context
- Accommodates workflow
- Easy to use
- OUTCOMES:
- Timeline: 4 months, under budget
- Quantitative: 92% Success (accomplish top 4 tasks in <2 minutes)
- Qualitative: YES, includes all info
This is a summary; for more in-depth details, please see KPI Dictionary case study (Link)